Platform Architecture
Introduction
The Nexus Data-AI Platform shape your data layer for AI diffusion.It's a layered AI operating system built around Ontologies, that put a structure on your existing data and enables you to perform seamless AI Analytics and AI Automations.

Ontology Support
At its core, the Nexus Data-AI Platform functions as an Ontology Operating System (Ontology OS). It provides the foundational AI engine—powered by distributed computing—alongside comprehensive AI Operations (AI-OS) capabilities required for modern ontology-driven systems.
The platform structures ontologies within a unified, layered architecture comprising three distinct planes: the Data Plane, the Control Plane, and the Reasoning Plane. Each plane addresses a specific domain of responsibility, and together they establish an intelligent stack that integrates enterprise data, constructs rich semantic context, and enables autonomous AI-driven analytics and automation.
While the platform includes sample ontologies to accelerate initial adoption, its primary purpose is to enable enterprises to design, deploy, and govern their own Ontology OS layer at scale.
Total System Architecture
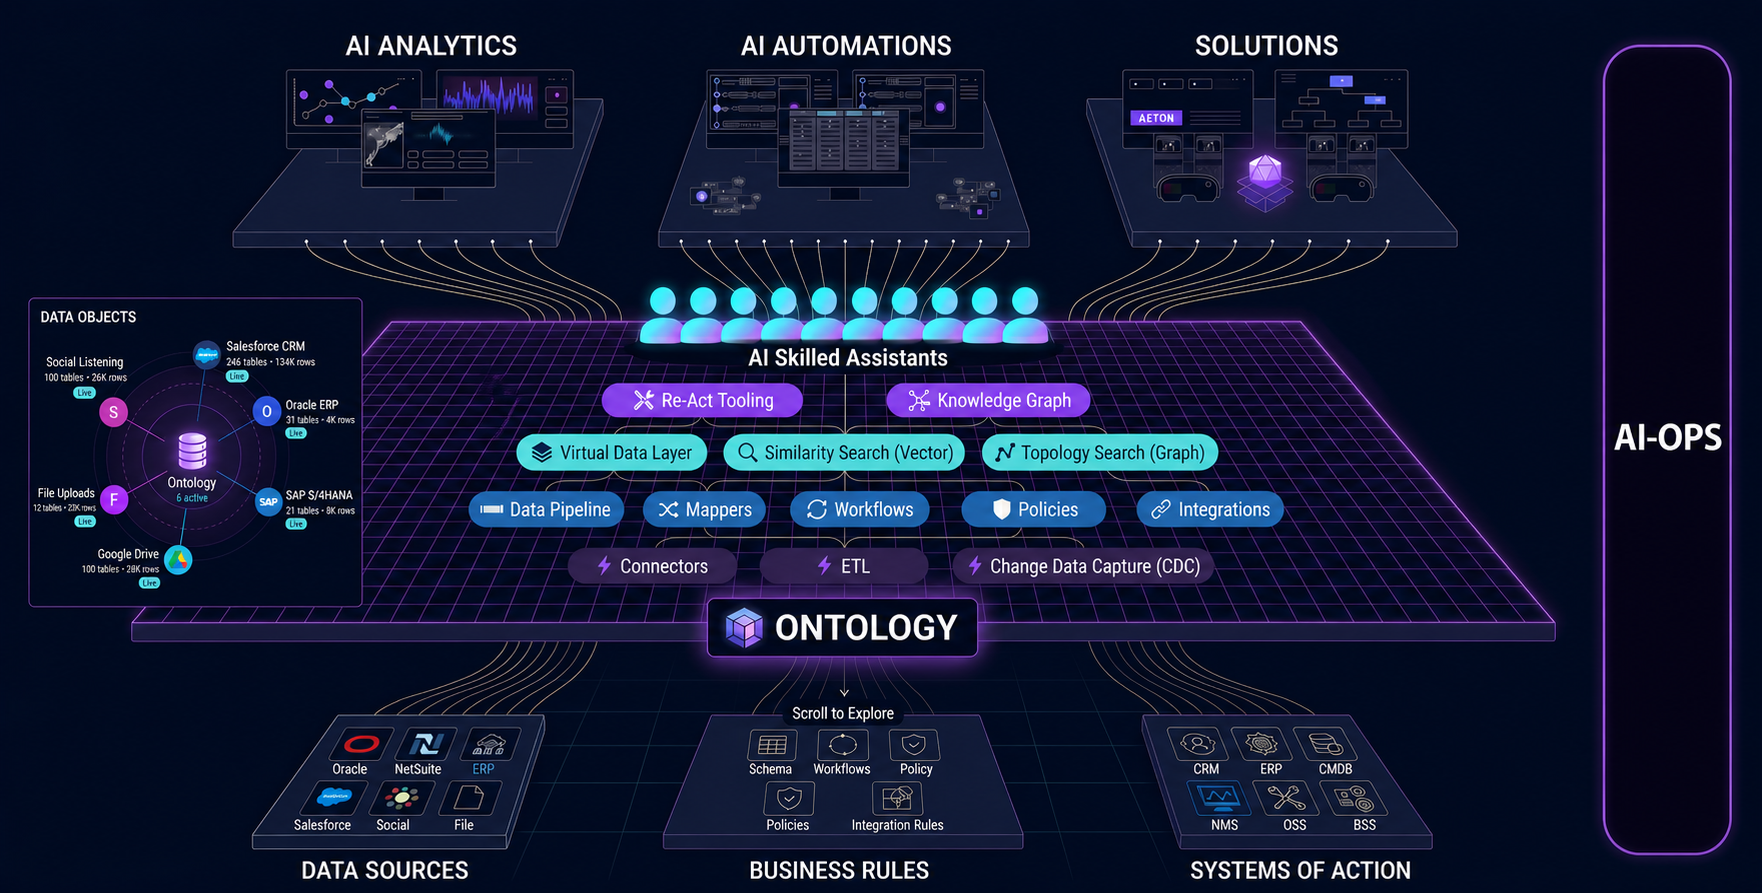
This is the end-to-end NexusAI runtime in a single picture. It captures how user intent is classified, how the ReAct engine plans and acts under policy, how the Control Plane retrieves semantic context, and how the Data Plane keeps everything grounded in live enterprise systems.

ASCII reference
┌────────────────────────────┐
│ User Interface │
│ (UI/ Chat / API / Copilot)│
└──────────────┬─────────────┘
│
▼
┌────────────────────────────┐
│ Identity & RBAC Layer │
│ (SSO, OAuth, SCIM) │
└──────────────┬───────────────┘
│
▼
┌────────────────────────────┐
│ Intent + Risk Analyzer │
│ (Classifies: read-only, │
│ low-risk write, high-risk │
│ write, cross-system) │
└──────────────┬───────────────┘
│
▼
┌───────────────────────────────────────────────────────────────┐
│ ReAct Planning Engine (LLM Agent Loop) │
│ │
│ PLAN → EXECUTE → OBSERVE → REPLAN → EXECUTE → OBSERVE │
│ │
│ 1. Receives user intent + risk classification │
│ 2. Queries Enterprise RAG for context ──────────────┐ │
│ 3. Reasons about next action │ │
│ 4. Selects tool from Tool Abstraction Layer │ │
│ 5. Policy Engine validates before execution │ │
│ 6. Observes result, replans if needed │ │
│ 7. Loops until goal achieved or step limit reached │ │
│ │ │
│ ┌────────────────────────────────────────────────┐ │ │
│ │ AI Applications (powered by this loop) │ │ │
│ │ - Fraud AI Assistant │ │ │
│ │ - AML Investigator Copilot │ │ │
│ │ - Risk Analytics Dashboard │ │ │
│ │ - Enterprise System Orchestrator │ │ │
│ └────────────────────────────────────────────────┘ │ │
│ │ │
│ ┌────────────────────────────────────────────────┐ │ │
│ │ Policy & Guardrail Core │ │ │
│ │ (OPA / Custom Engine) │ │ │
│ │ - Approval thresholds - Close windows │ │ │
│ │ - Field-level access - Cross-system checks │ │ │
│ │ - Risk-based routing - Dry-run mode │ │ │
│ │ - Max step limits - Audit logging │ │ │
│ └────────────────────────────────────────────────┘ │ │
│ │ │
│ ┌────────────────────────────────────────────────┐ │ │
│ │ Tool Abstraction Layer (Controlled APIs) │ │ │
│ │ - get_account() - propose_credit_change()│ │ │
│ │ - get_ar_balance() - submit_gl_adjustment() │ │ │
│ │ - create_customer() - trigger_workflow() │ │ │
│ │ LLM never calls raw APIs — only safe tools │ │ │
│ └────────────────────────────────────────────────┘ │ │
└──────────────────────┬─────────────────────────────────┘──────┘
│ ▲
│ (RAG feedback loop)
▼ │
┌──────────────────────────────────────────────────────────────────────────┐
│ │
│ AI-CONTROL-PLANE │
│ (Semantic Intelligence & Reasoning Layer) │
│ │
│ ┌───────────────────────────────────────────────────────────────┐ │
│ │ Enterprise RAG Layer │ │
│ │ (Semantic Retrieval for LLM Context) │ │
│ │ │ │
│ │ Retrieves from Vector DB + Graph DB to provide: │ │
│ │ - Schema & field definitions │ │
│ │ - Business policies & approval rules │ │
│ │ - Workflow dependencies & process rules │ │
│ │ - API specs & integration mappings │ │
│ │ - Cross-system dependency awareness │ │
│ │ │ │
│ │ Answers: "Which object stores credit risk?" │ │
│ │ "What triggers approval workflow?" │ │
│ │ "What fields are required for customer creation?" │ │
│ │ "What is the ERP sync dependency?" │ │
│ │ │ │
│ │ This is semantic retrieval, not relational querying. │ │
│ └──────────────────────┬────────────────────────────────────────┘ │
│ │ │
│ ┌──────────┼──────────────────────┐ │
│ │ │ │ │
│ ┌──────────────┐ ┌──────────────┐ ┌──────────────┐ │
│ │ Graph Query │ │ Vector Search│ │ ML Scoring │ │
│ │ + Reasoner │ │ (Similarity) │ │ Engine │ │
│ └──────┬───────┘ └──────┬───────┘ └──────┬───────┘ │
│ │ │ │ │
│ ┌───────────────────────────────────────────────────────────────┐ │
│ │ Intelligence Layer │ │
│ │ │ │
│ │ ┌──────────────────┐ ┌────────────────────────────┐ │ │
│ │ │ Graph DB │ │ Vector DB │ │ │
│ │ │ (Ontology + RDF) │ │ (Embeddings Store) │ │ │
│ │ │ │ │ │ │ │
│ │ │ Structural │ │ Semantic Knowledge: │ │ │
│ │ │ Knowledge: │ │ - Schema embeddings │ │ │
│ │ │ - Accounts │ │ - Policy embeddings │ │ │
│ │ │ - Transactions │ │ - Workflow embeddings │ │ │
│ │ │ - Customers │ │ - API spec embeddings │ │ │
│ │ │ - Risk Rules │ │ - Process rule embeddings │ │ │
│ │ │ - Relationships │ │ - Fraud case embeddings │ │ │
│ │ │ - Ontology │ │ - Customer embeddings │ │ │
│ │ │ │ │ │ │ │
│ │ └────────┬─────────┘ └──────────┬─────────────────┘ │ │
│ └───────────┼────────────────────────────┼───────────────────────┘ │
│ │ │ │
└──────────────┼────────────────────────────┼──────────────────────────────┘
│ │
┌──────────────────┼────────────────────────────────┼───────────────────┐
│ │ │ │
│ │ AI-DATA-PLANE │ │
│ │ (Data Ingestion & Transformation) │
│ │ │ │
│ ┌────────────┴──────────┬─────────────────────┴────────────┐ │
│ │ │ │ │
│ │ CDC Path │ ETL Path FDW Path │ │
│ │ │ │ │
│ ▼ ▼ ▼ │
│ ┌──────────────┐ ┌───────────────────┐ ┌───────────────────┐│
│ │ RDF Stream │ │ RDF Batch │ │ FDW Wrapper ││
│ │ Processor │ │ Transformer │ │ (Virtual Access) ││
│ │ (CDC→Ontology│ │ (R2RML / Batch) │ │ ││
│ │ Mapper) │ │ │ │ Postgres FDW / ││
│ └──────┬───────┘ └────────┬──────────┘ │ Trino / Presto ││
│ │ │ └────────┬──────────┘│
│ ▼ ▼ │ │
│ ┌──────────────┐ ┌───────────────────┐ │ │
│ │ Kafka │ │ ETL Engine │ │ │
│ │ │ │ (Spark / Airflow │ │ │
│ └──────┬───────┘ │ / Custom) │ │ │
│ │ └────────┬──────────┘ │ │
│ ▼ │ │ │
│ ┌──────────────┐ │ │ │
│ │ CDC Engine │ │ │ │
│ │ (Debezium) │ │ │ │
│ └──────┬───────┘ │ │ │
│ │ │ │ │
│ ▼ ▼ ▼ │
│ ┌─────────────────────────────────────────────────────────────────┐ │
│ │ Enterprise Source Systems │ │
│ │ │ │
│ │ ┌──────────────┐ ┌──────────────┐ ┌──────────┐ ┌──────────┐│ │
│ │ │ Core Banking │ │ ERP / GL │ │ CRM │ │ Legacy ││ │
│ │ │ (Temenos / │ │ (SAP / │ │(Salesforce│ │ Systems ││ │
│ │ │ Finacle) │ │ Oracle) │ │ / Custom)│ │ / Files ││ │
│ │ └──────────────┘ └──────────────┘ └──────────┘ └──────────┘│ │
│ │ │ │
│ │ CDC: Real-time event streams from transaction-heavy systems │ │
│ │ ETL: Batch extraction for historical, analytical & master data │ │
│ │ FDW: Virtual access for low-volume / governance-restricted data│ │
│ └─────────────────────────────────────────────────────────────────┘ │
│ │
└──────────────────────────────────────────────────────────────────────┘
System Components
The diagram below decomposes the NexusAI platform into six numbered layers — from Enterprise Systems at the foundation, through the Data, Control, and Reasoning Planes, up to the Skilled Resource and Business Capability layers that users interact with.

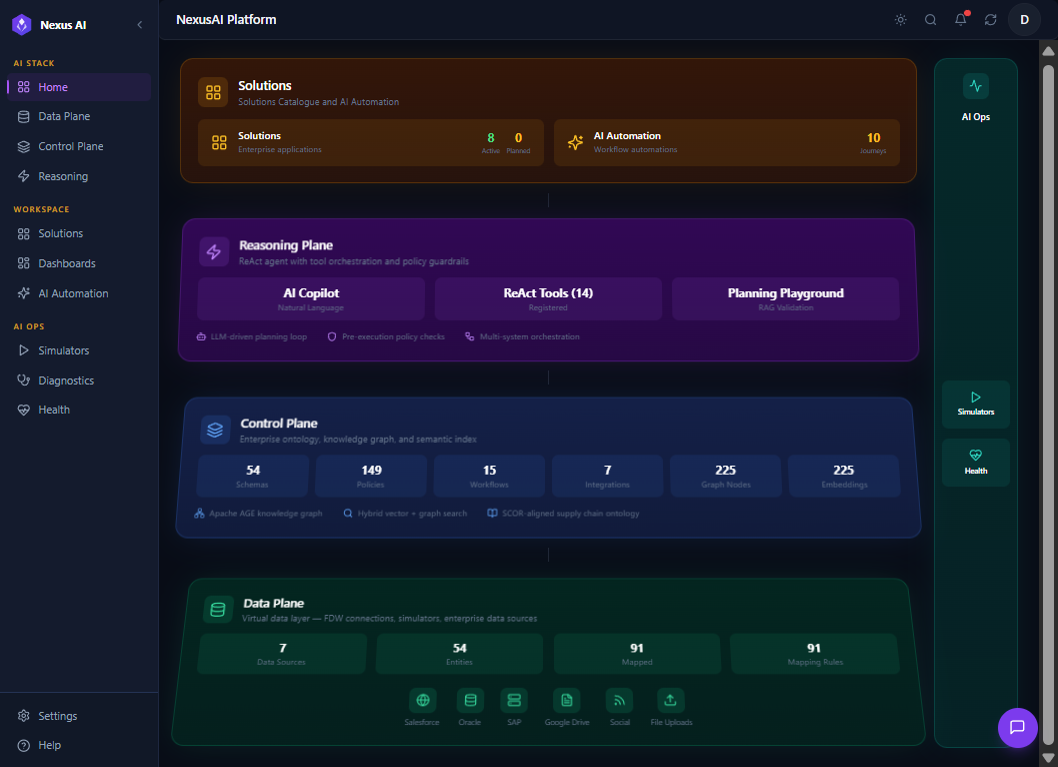
Product Home Overview
NexusAI sits as a thin, intelligent layer on top of the systems you already run — no rip-and-replace, no data migration, no silos. The image below shows the same platform from a product perspective: how the planes compose into an end-to-end stack that enterprises consume as Business Capabilities, with governance, observability, and human oversight built in by default.
Data Plane
The Data Plane unifies disparate enterprise systems into a single Virtual Data Layer (VDL). Source data is hydrated into the VDL through three complementary mechanisms -- FDW Connectors, ETL Pipelines, and Change Data Capture (CDC) -- chosen per source based on latency, payload shape, and read/write patterns. Once hydrated, every entity is queryable through the same API regardless of how it arrived.
VDL Hydration Mechanisms
| Mechanism | When to use | Latency | Typical sources |
|---|---|---|---|
| FDW Connectors | Live federated reads against transactional systems of record | Milliseconds | Salesforce, Oracle ERP, SAP S/4HANA, BSSMagic CRM |
| ETL Pipelines | Bulk ingest, transformation, and enrichment of file or document sources | Minutes to hours | Google Drive, file uploads, market signals, sustainability reports |
| Change Data Capture (CDC) | Streaming incremental changes from operational systems | Seconds | Kafka/Debezium event streams, transactional change feeds |
Data Plane Walkthrough
The Data Plane is exposed through six tabs in the NexusAI workspace, each focused on a distinct part of the hydration lifecycle.
Data Sources
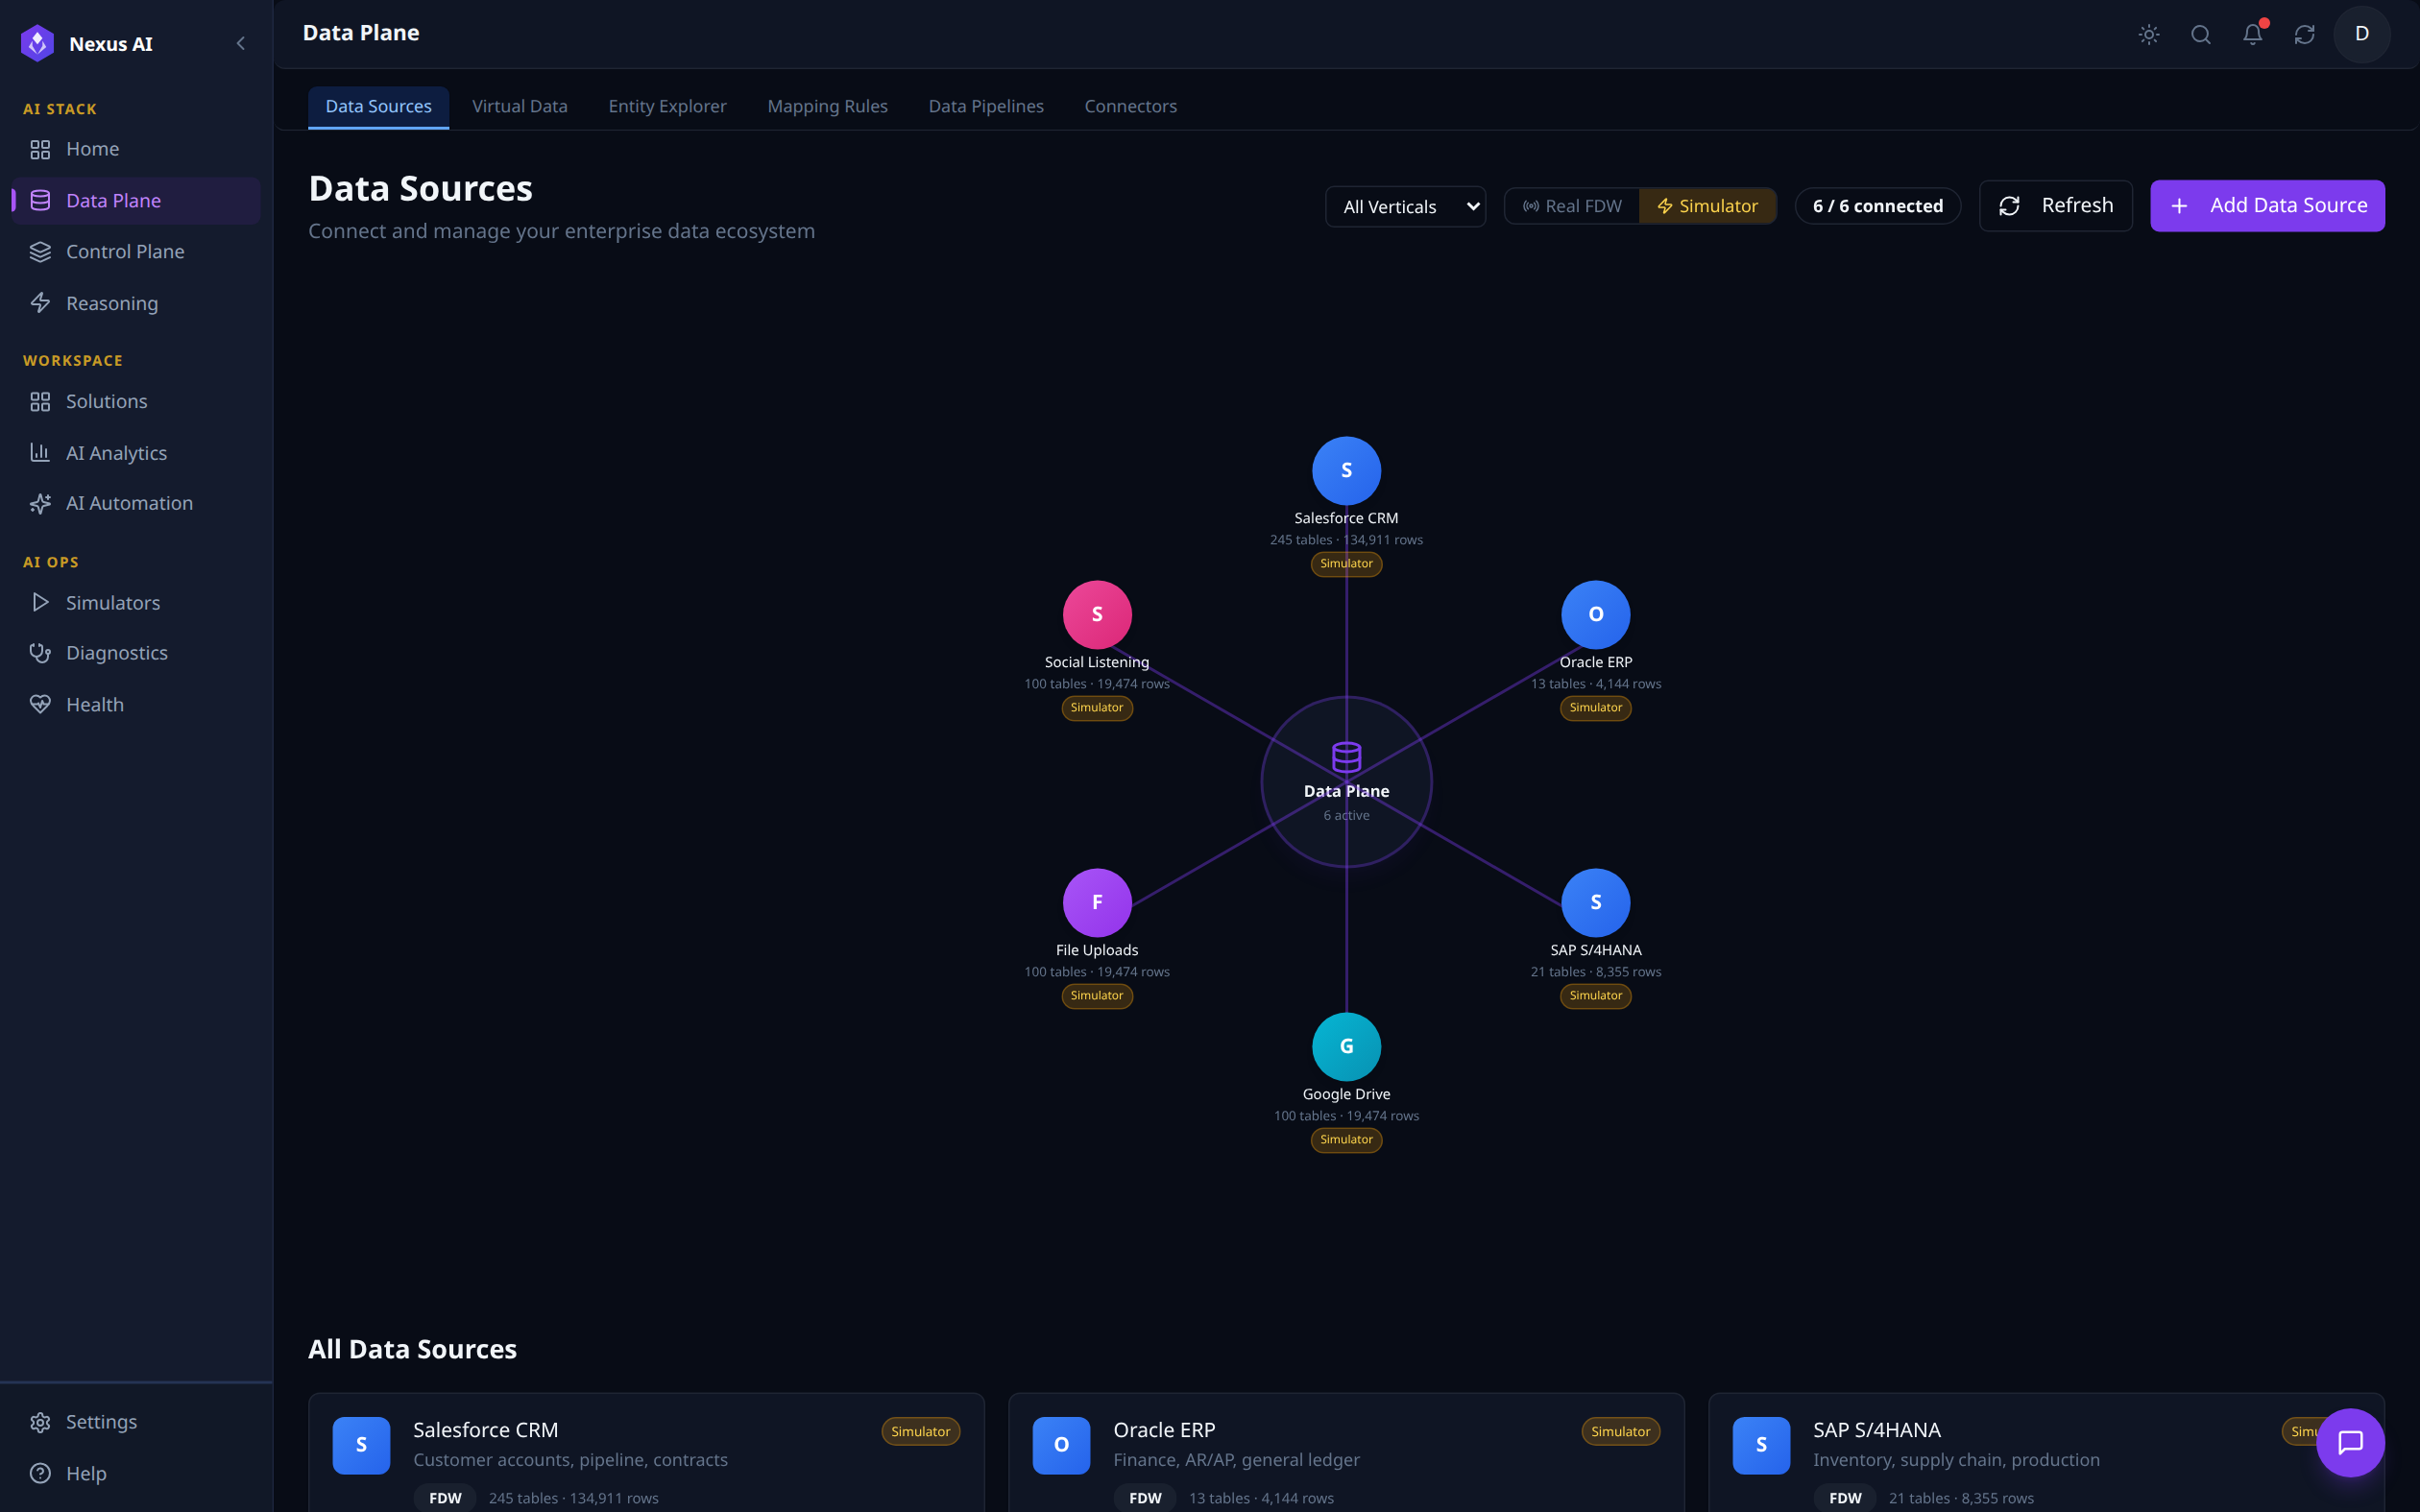
A hub-and-spoke view of every connected enterprise system, with table and row counts per source. The top toolbar filters by vertical, toggles between Real FDW and Simulator mode, refreshes status, or adds a new source. The 6 / 6 connected indicator confirms all sources are healthy; the All Data Sources list below shows each system's mode (FDW vs. simulated) at a glance.
Virtual Data
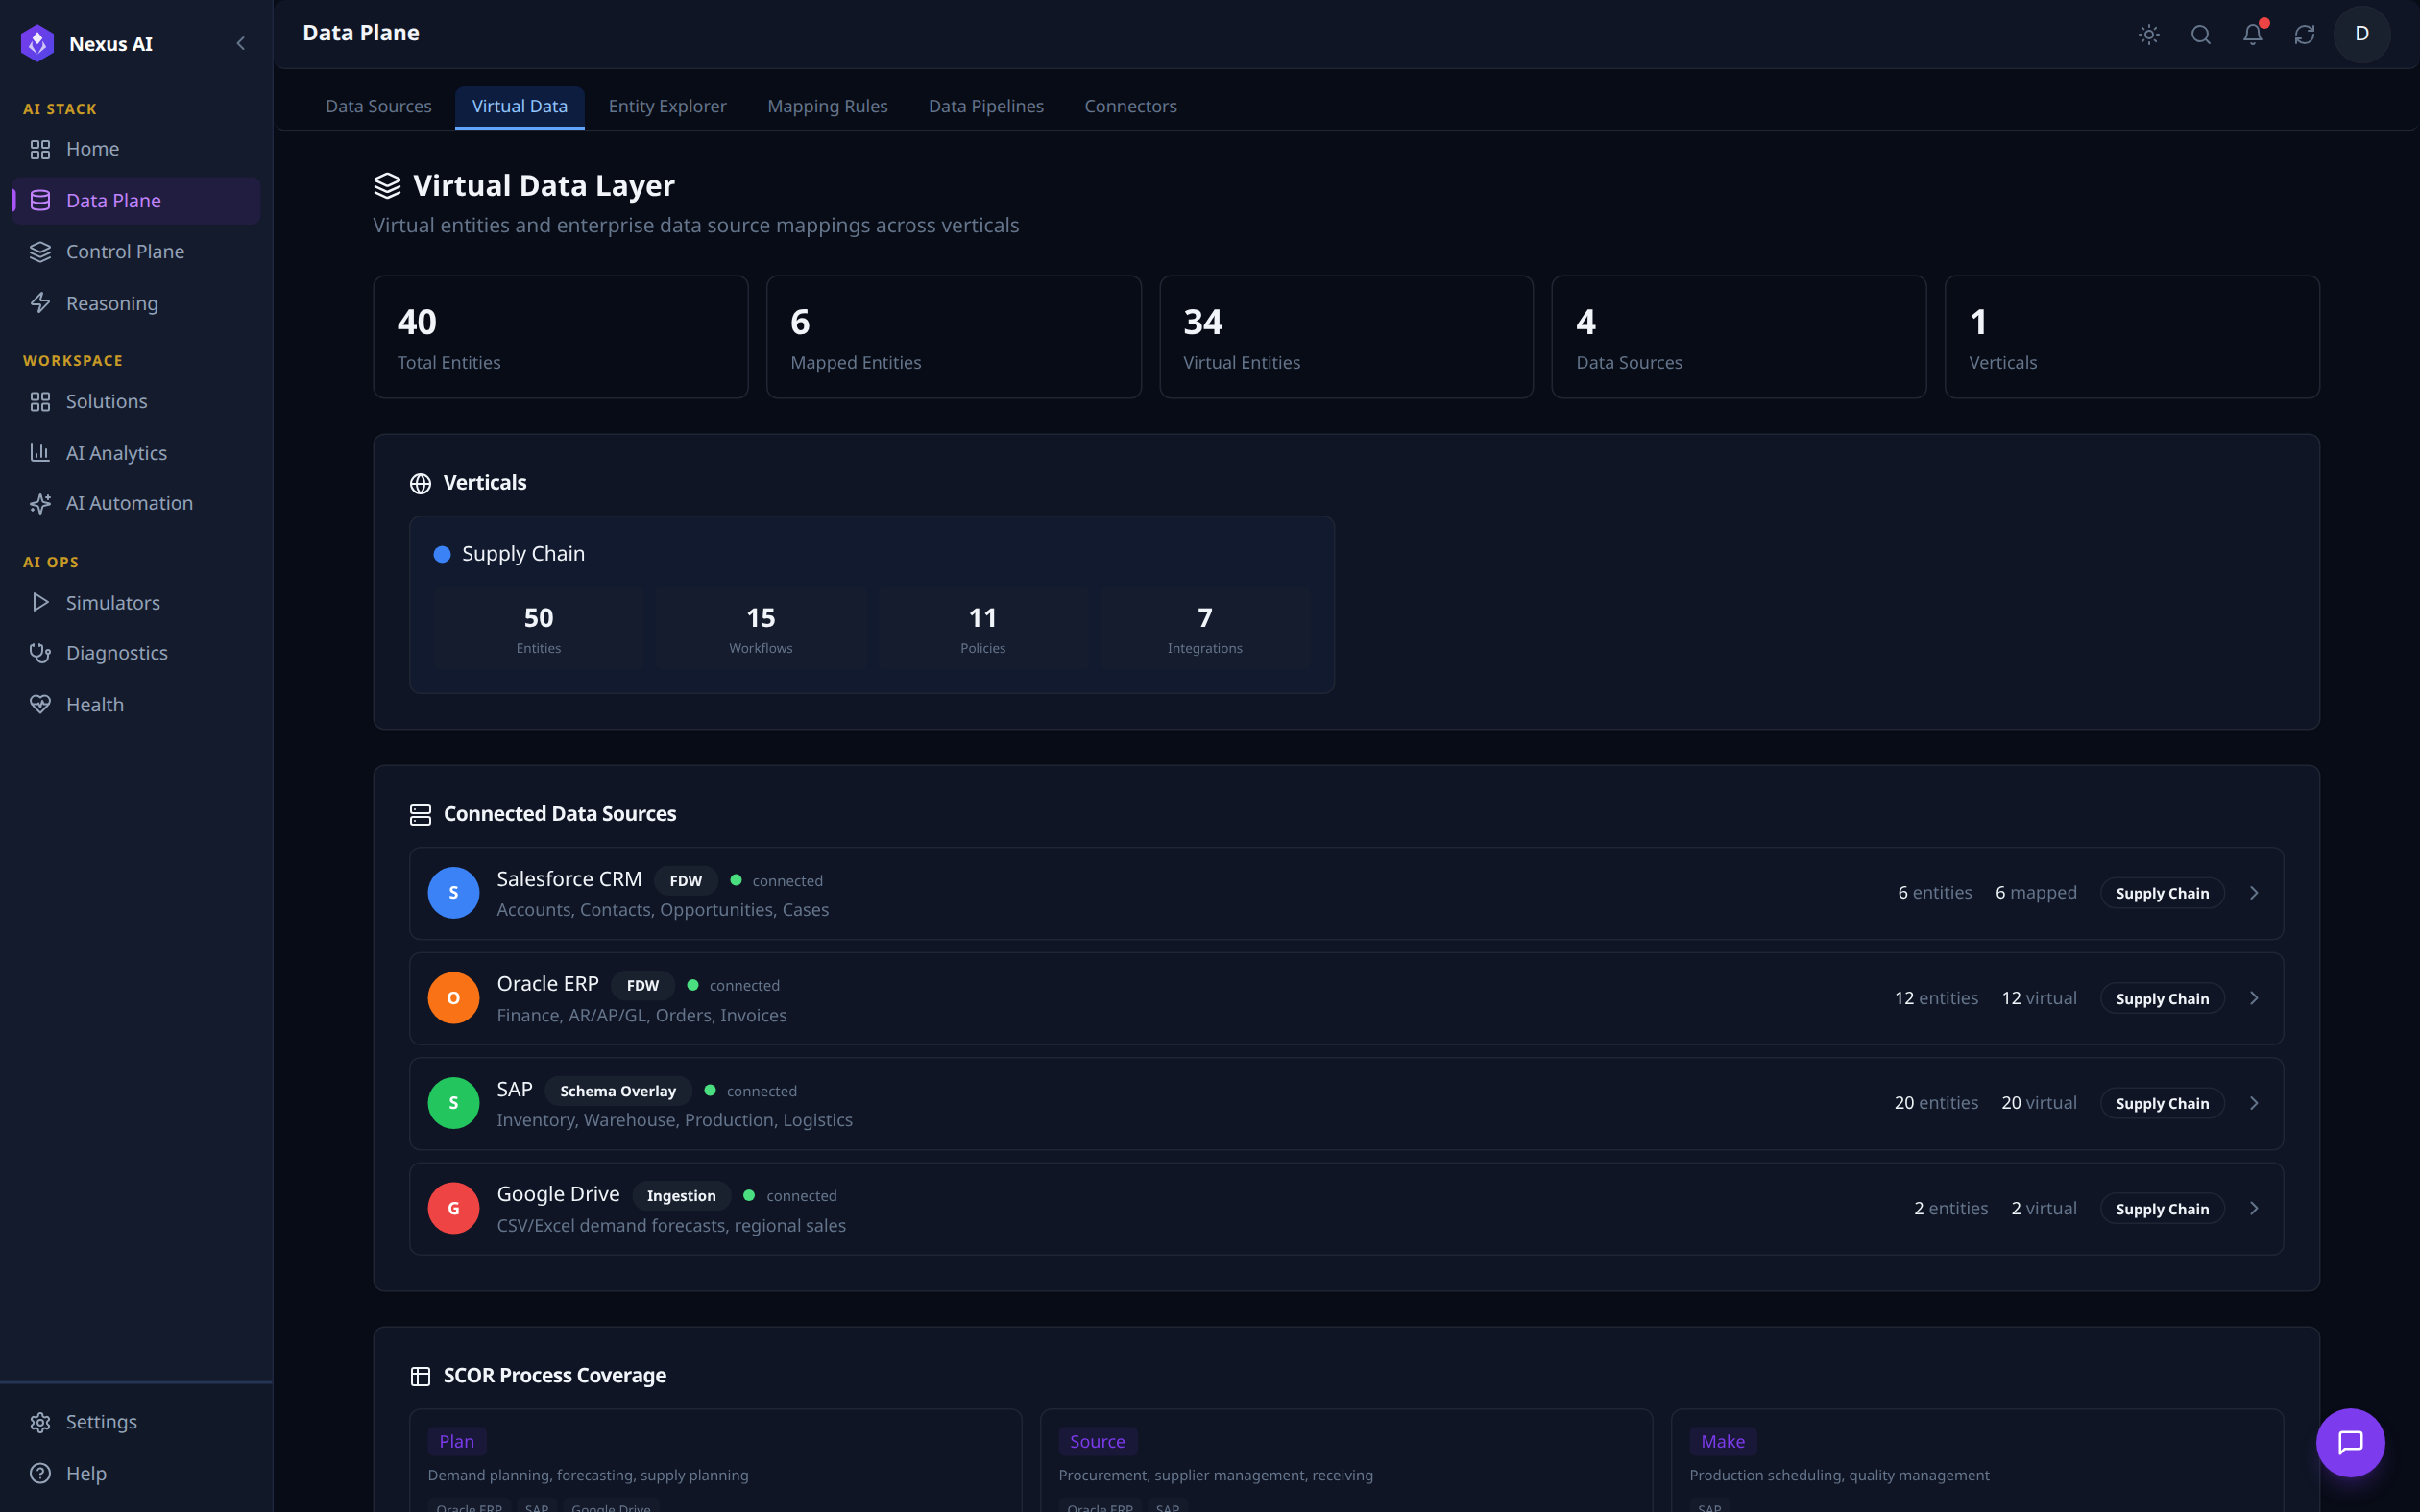
Top-line counters summarise total, mapped, and virtual entities along with active data sources and verticals. Each vertical (Supply Chain in this view) breaks out its entity, workflow, policy, and integration counts. The Connected Data Sources list shows how many entities each system contributes and which integration mode is in use -- FDW, Schema Overlay, or Ingestion.
Entity Explorer
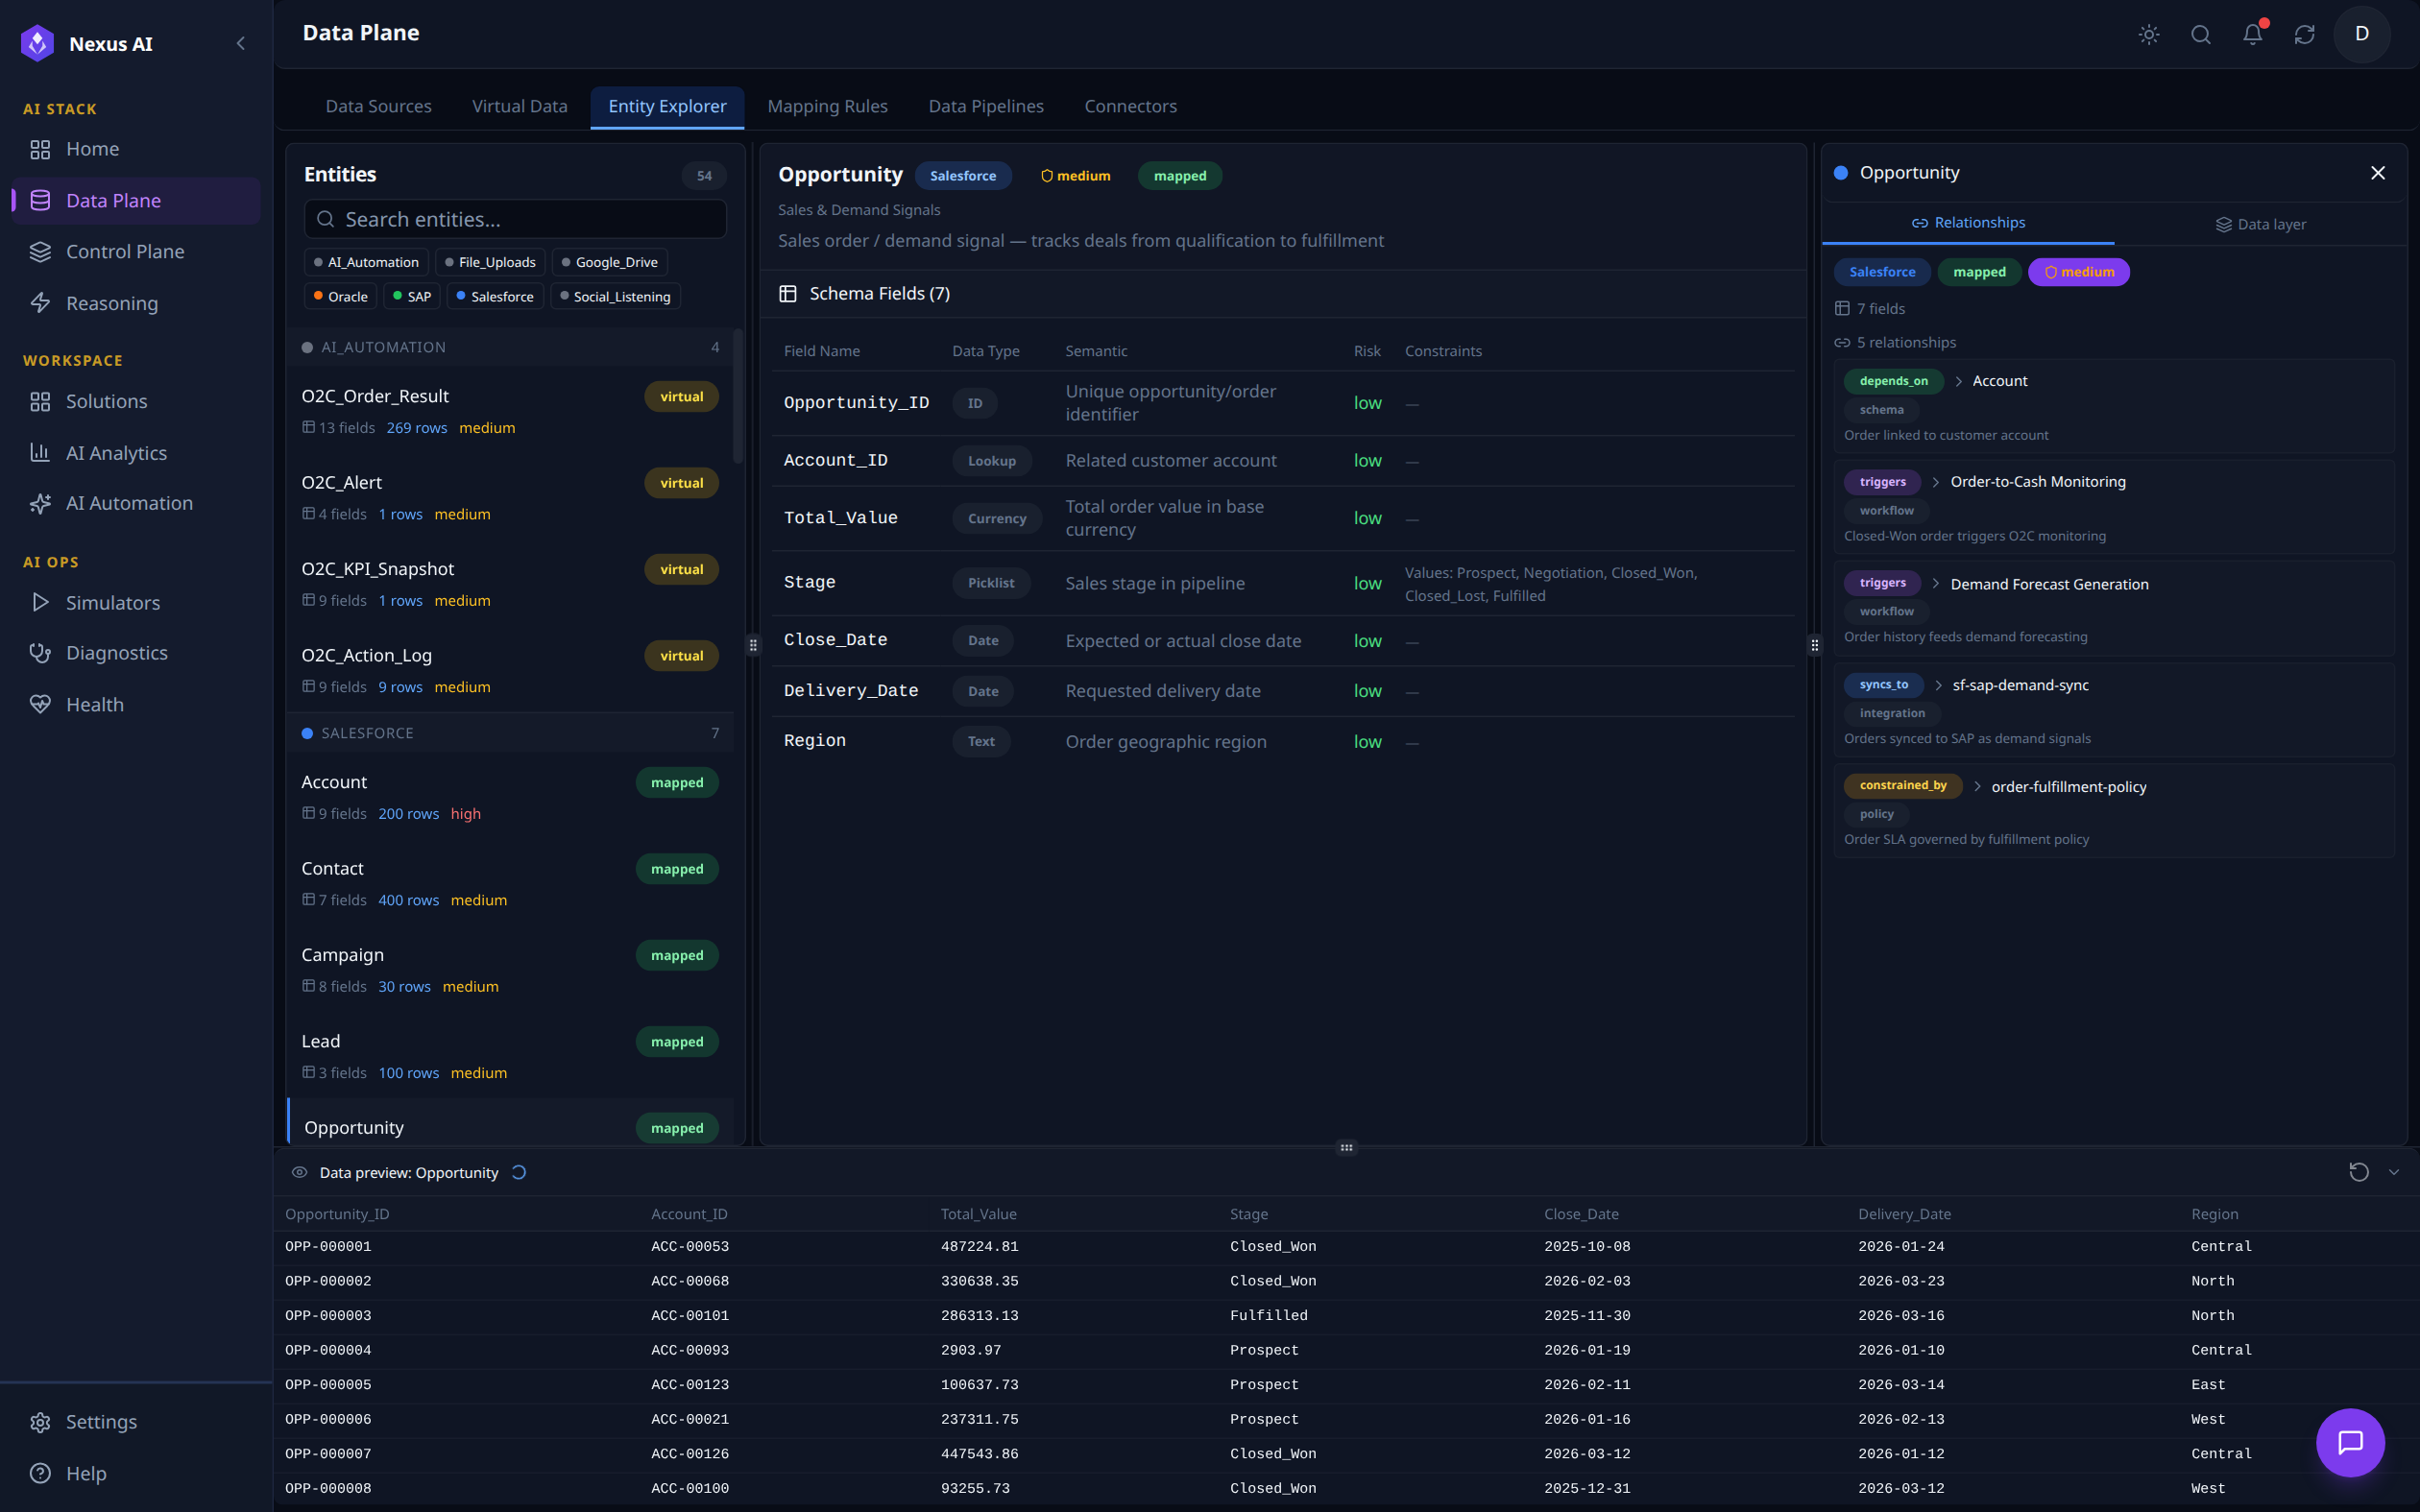
A three-pane browser for inspecting every virtual entity in the platform. The left panel groups entities by source (Salesforce, SAP, Oracle, AI_Automation, etc.) and tags each as virtual or mapped. With the Opportunity entity selected above, the centre pane shows its Schema Fields (7 fields, each with data type, semantic, risk, and constraints), the right pane lists its 5 Relationships -- depends_on Account, triggers Order-to-Cash Monitoring, triggers Demand Forecast Generation, syncs_to sf-sap-demand-sync, and constrained_by order-fulfillment-policy -- and the bottom pane previews live row data.
Mapping Rules
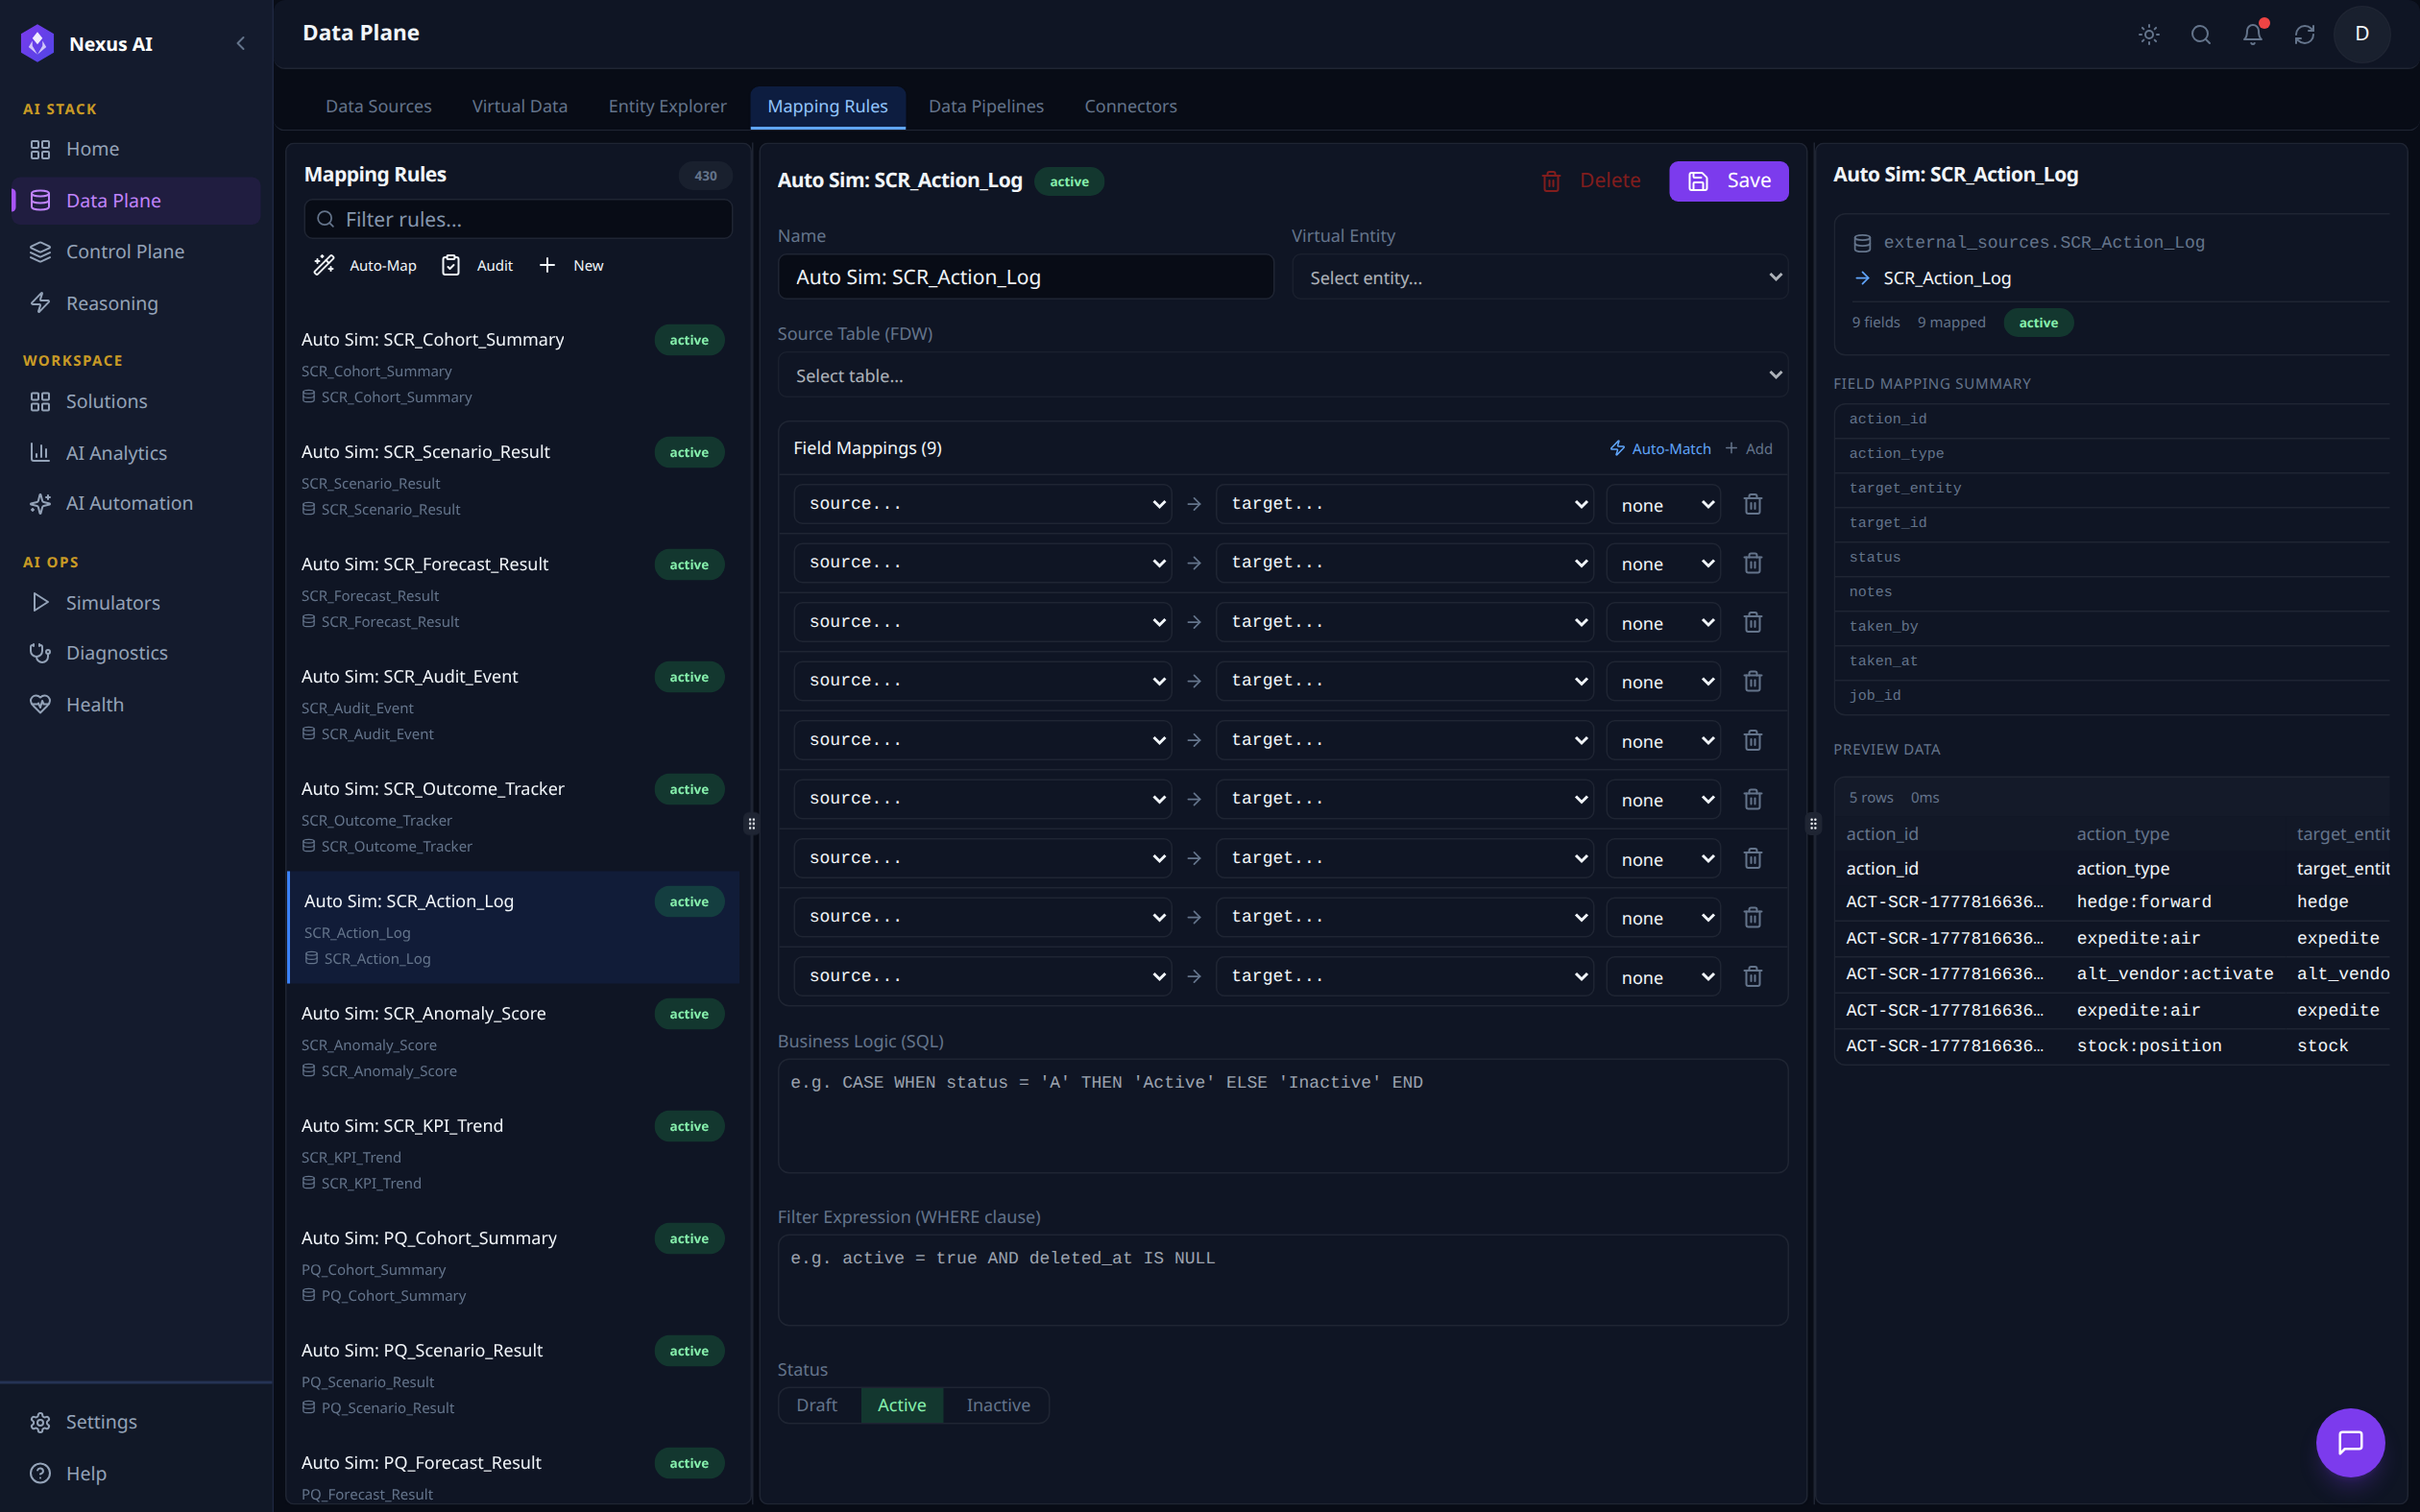
Manages the rules that map raw source fields onto ontology objects. The left panel lists every active rule grouped by source, with quick actions for Auto-Map, Audit, and adding a New rule. With Auto Sim: SCR_Action_Log selected here, the centre pane opens the rule editor (Name, Virtual Entity, Source Table, 9 source-to-target Field Mappings, Business Logic SQL, Filter Expression, Status), while the right pane summarises the resolved mapping (external_sources.SCR_Action_Log -> SCR_Action_Log, 9 of 9 fields mapped) and shows a live preview of the first 5 rows.
Data Pipelines
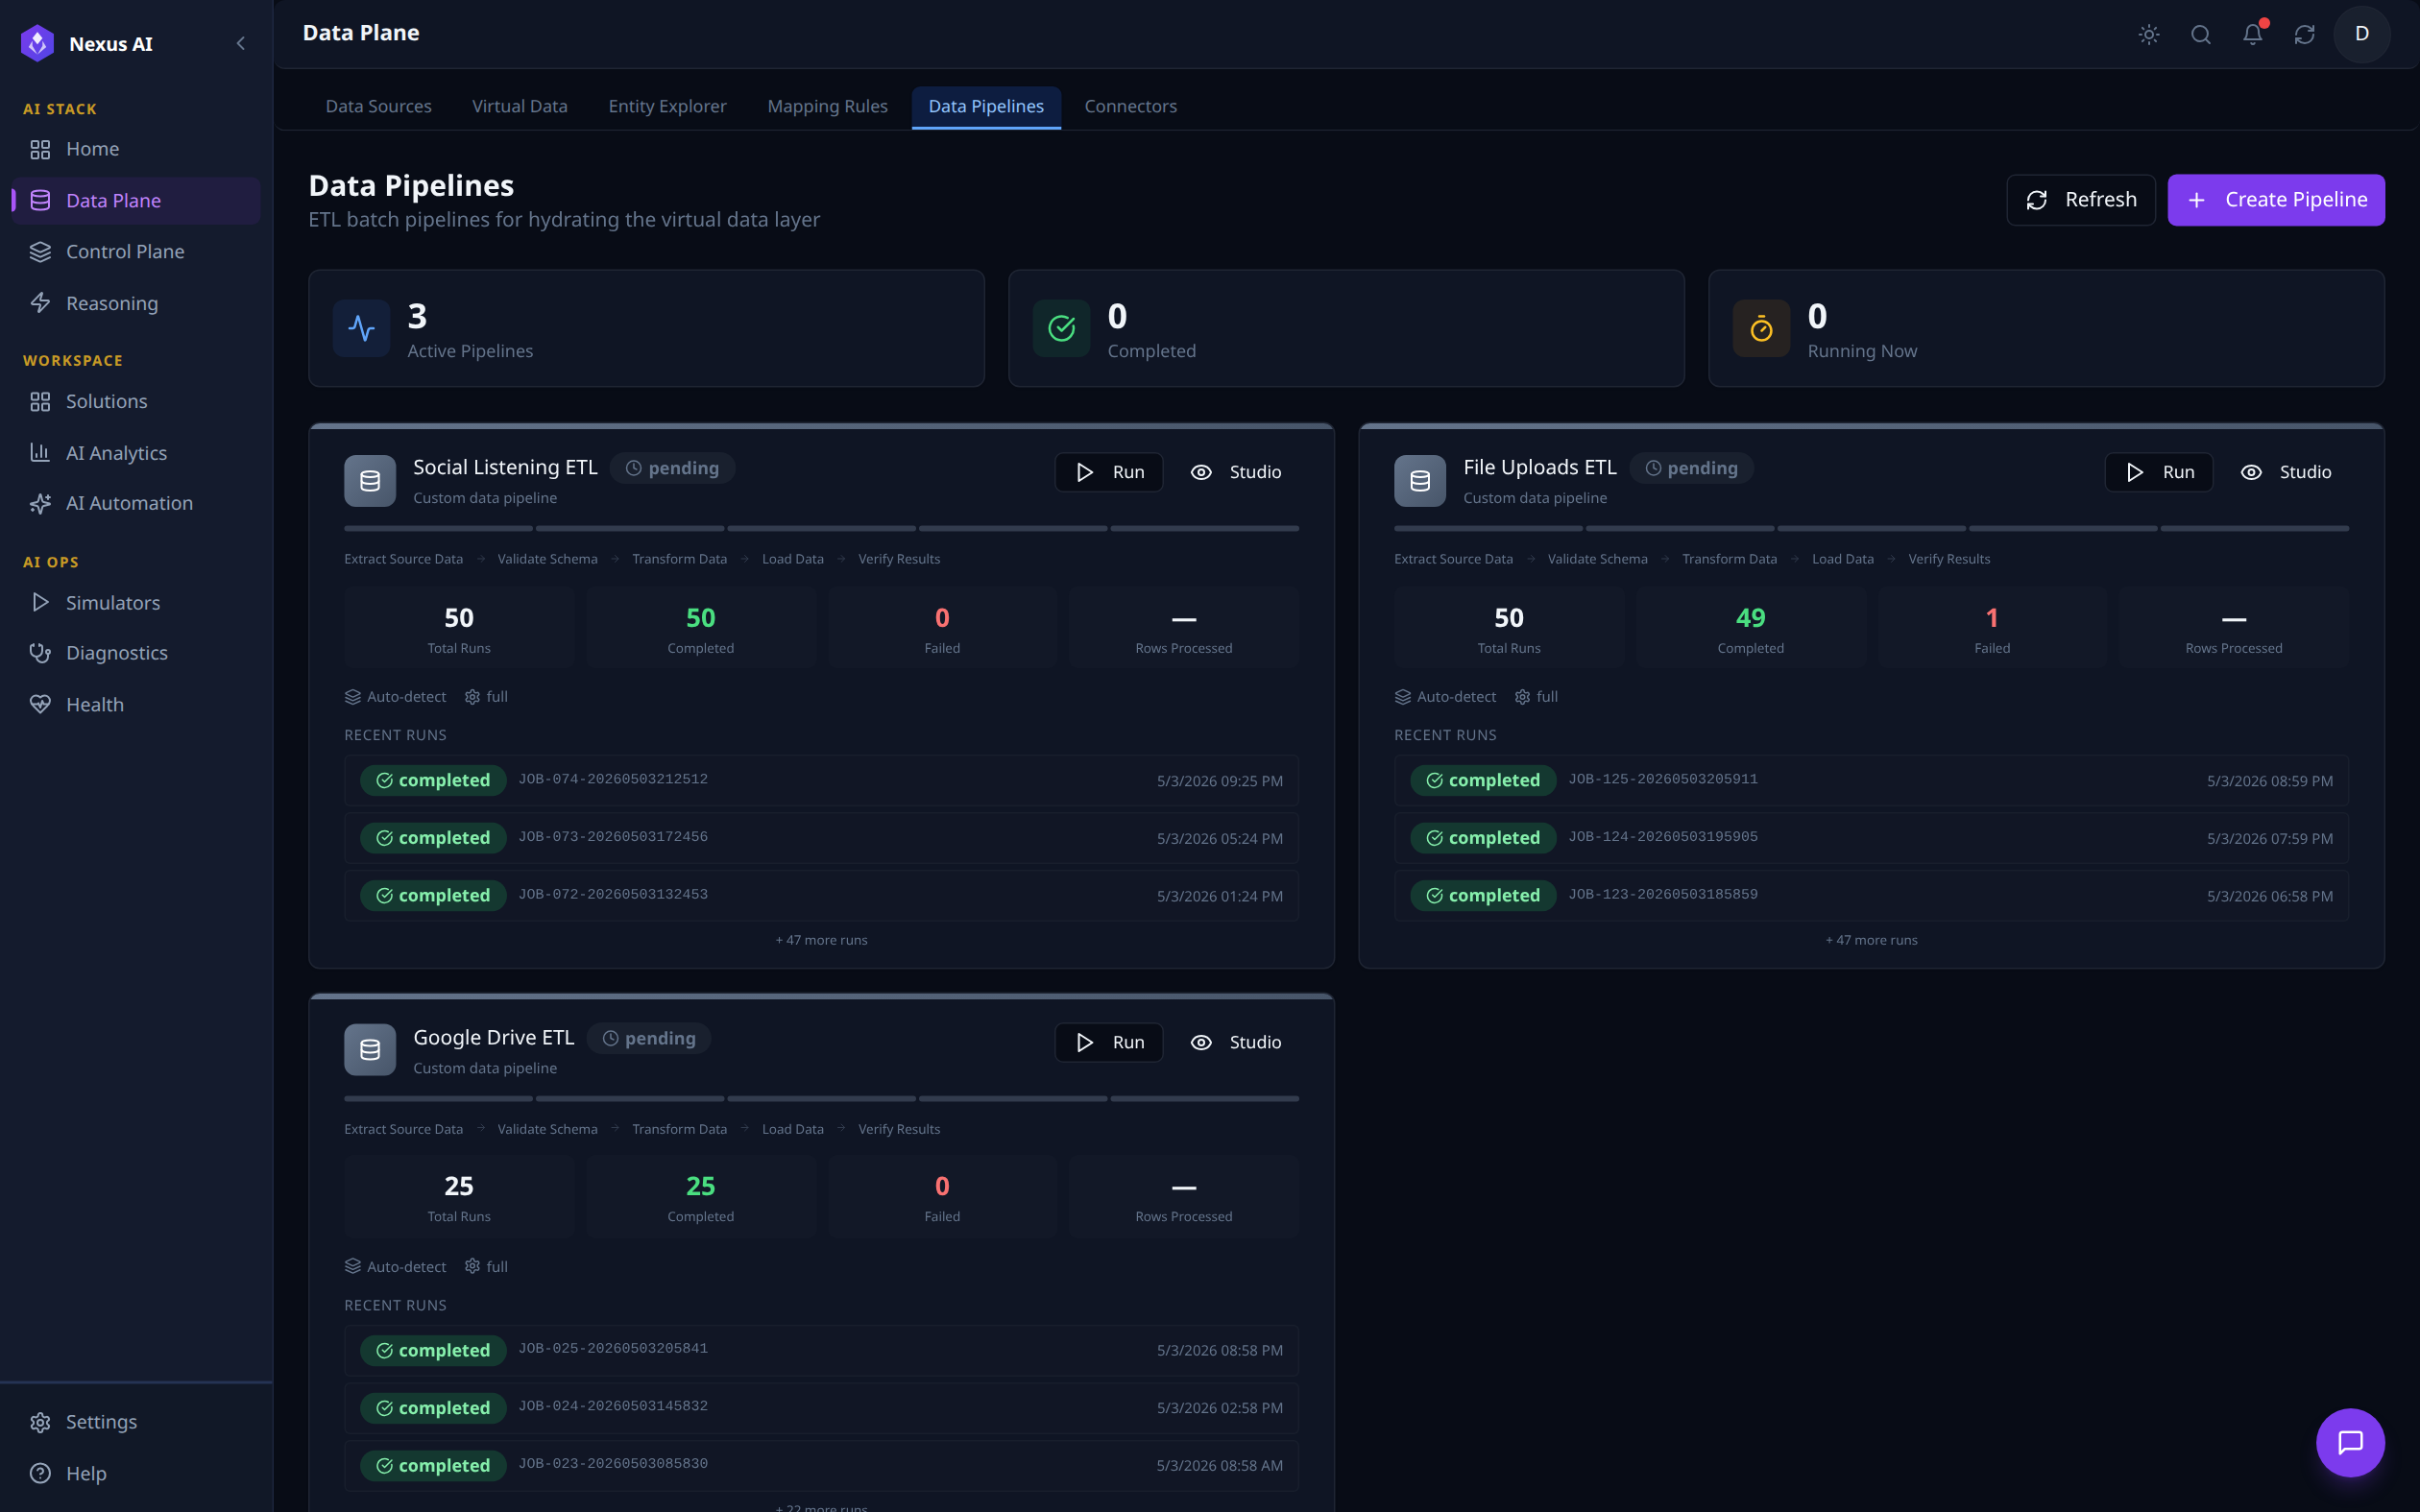
ETL batch pipelines that hydrate the Virtual Data Layer from non-FDW sources. Counters at the top track Active, Completed, and Running Now pipelines. Each pipeline card visualises its stage flow (Extract -> Validate -> Transform -> Load -> Verify) and a rolling history of recent runs with completion status, timestamps, and row counts.
Connectors
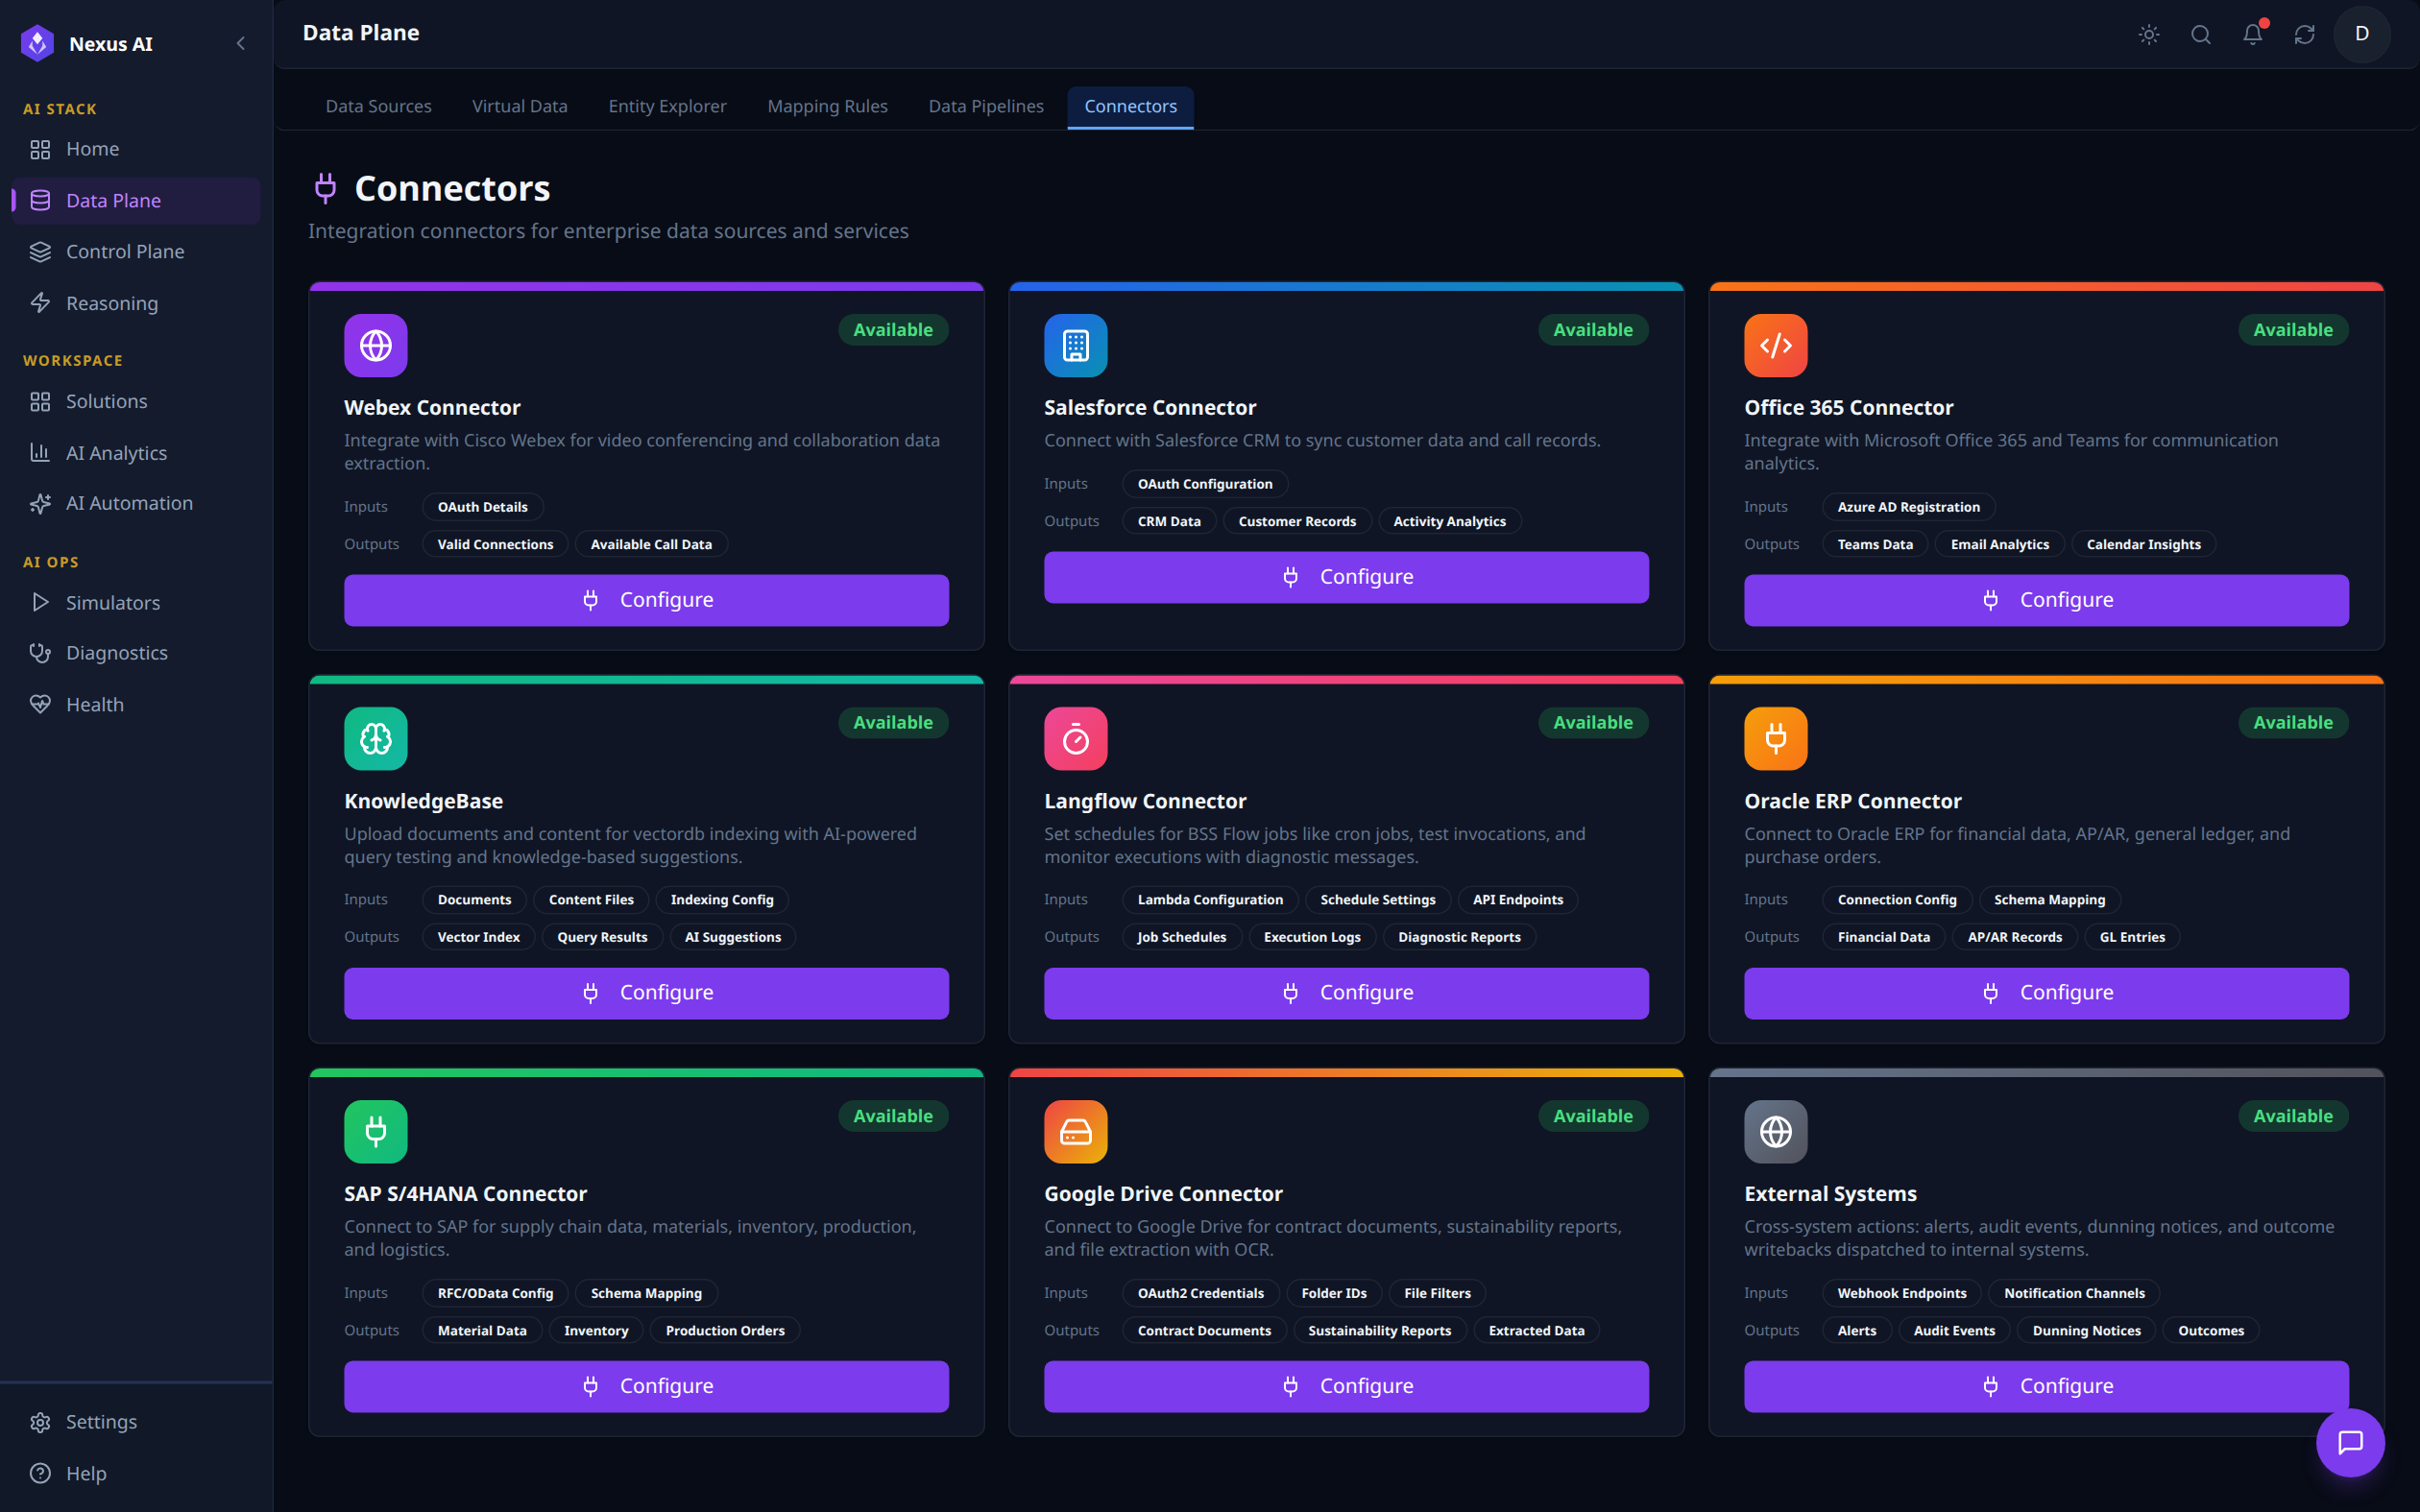
Catalogue of integration connectors available for hydration and outbound action. Each card describes the connector's typical Inputs (e.g., OAuth Configuration, RFC/OData Config) and Outputs (e.g., CRM Data, Material Data, Vector Index), with a Configure action to wire it up. Built-in connectors include Salesforce, Office 365, Oracle ERP, SAP S/4HANA, Google Drive, Webex, KnowledgeBase, Langflow, and a generic External Systems writeback channel.
Control Plane
The Control Plane builds a semantic understanding of the enterprise by combining an ontology layer, a knowledge graph (Apache AGE), and a vector embedding index (pgvector). It is the brain that gives AI the context to reason about business data.
Capabilities
| Component | Technology | Purpose |
|---|---|---|
| Ontology Schemas | YAML-defined | Business entity definitions (customers, orders, assets, contracts) |
| Policies | Rule engine | Business rules, guardrails, compliance constraints |
| Workflows | Orchestration | Multi-step business process definitions |
| Integrations | Connector config | System-to-system integration mappings |
| Knowledge Graph | Apache AGE (PostgreSQL) | Entity relationships, graph traversal, connected reasoning |
| Semantic Index | pgvector (PostgreSQL) | Vector embeddings for hybrid search (semantic + graph) |
Control Plane Walkthrough
The Control Plane is exposed through six tabs in the NexusAI workspace, covering ingestion, retrieval, governance, and orchestration of the platform's semantic layer.
Knowledge Pipeline
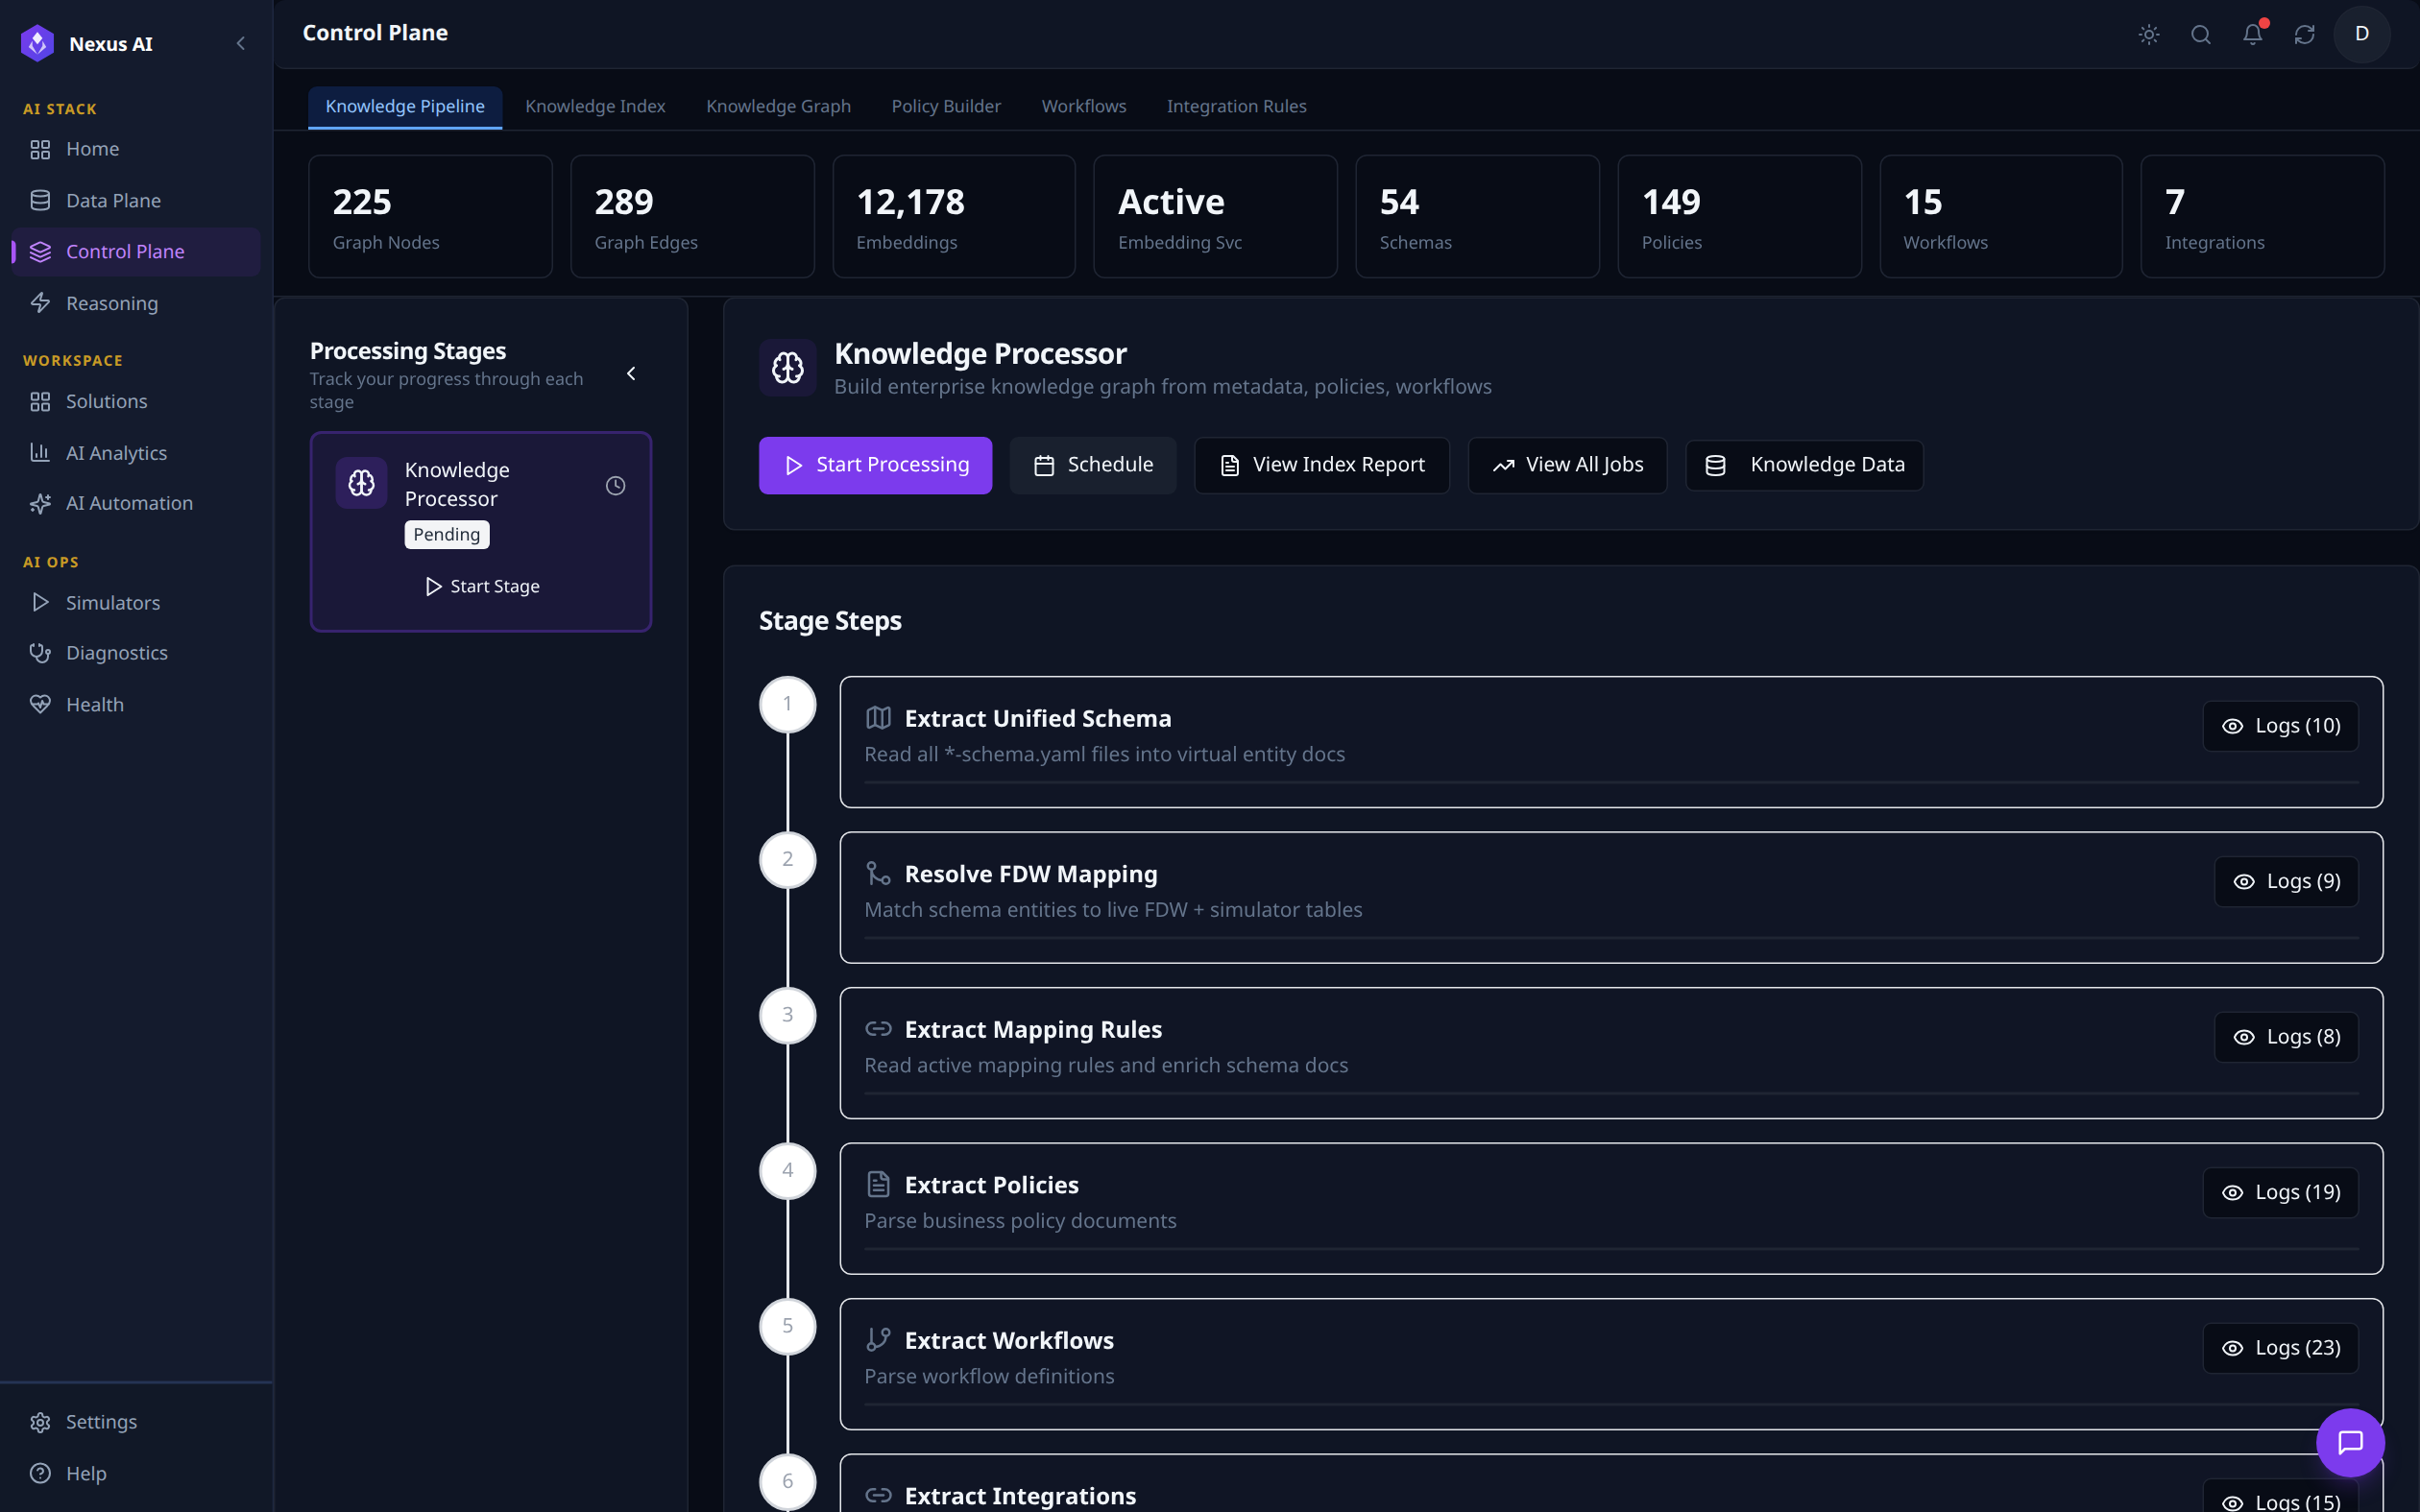
Operational dashboard for the ingestion process that builds the knowledge graph and embedding index. Top counters surface real-time graph size (225 nodes, 289 edges), embeddings (12,178), and ontology totals (54 Schemas, 149 Policies, 15 Workflows, 7 Integrations). The Knowledge Processor card lets you trigger the pipeline manually or schedule it; Stage Steps below shows the six-stage flow -- Extract Unified Schema -> Resolve FDW Mapping -> Extract Mapping Rules -> Extract Policies -> Extract Workflows -> Extract Integrations -- with per-stage logs.
Knowledge Index
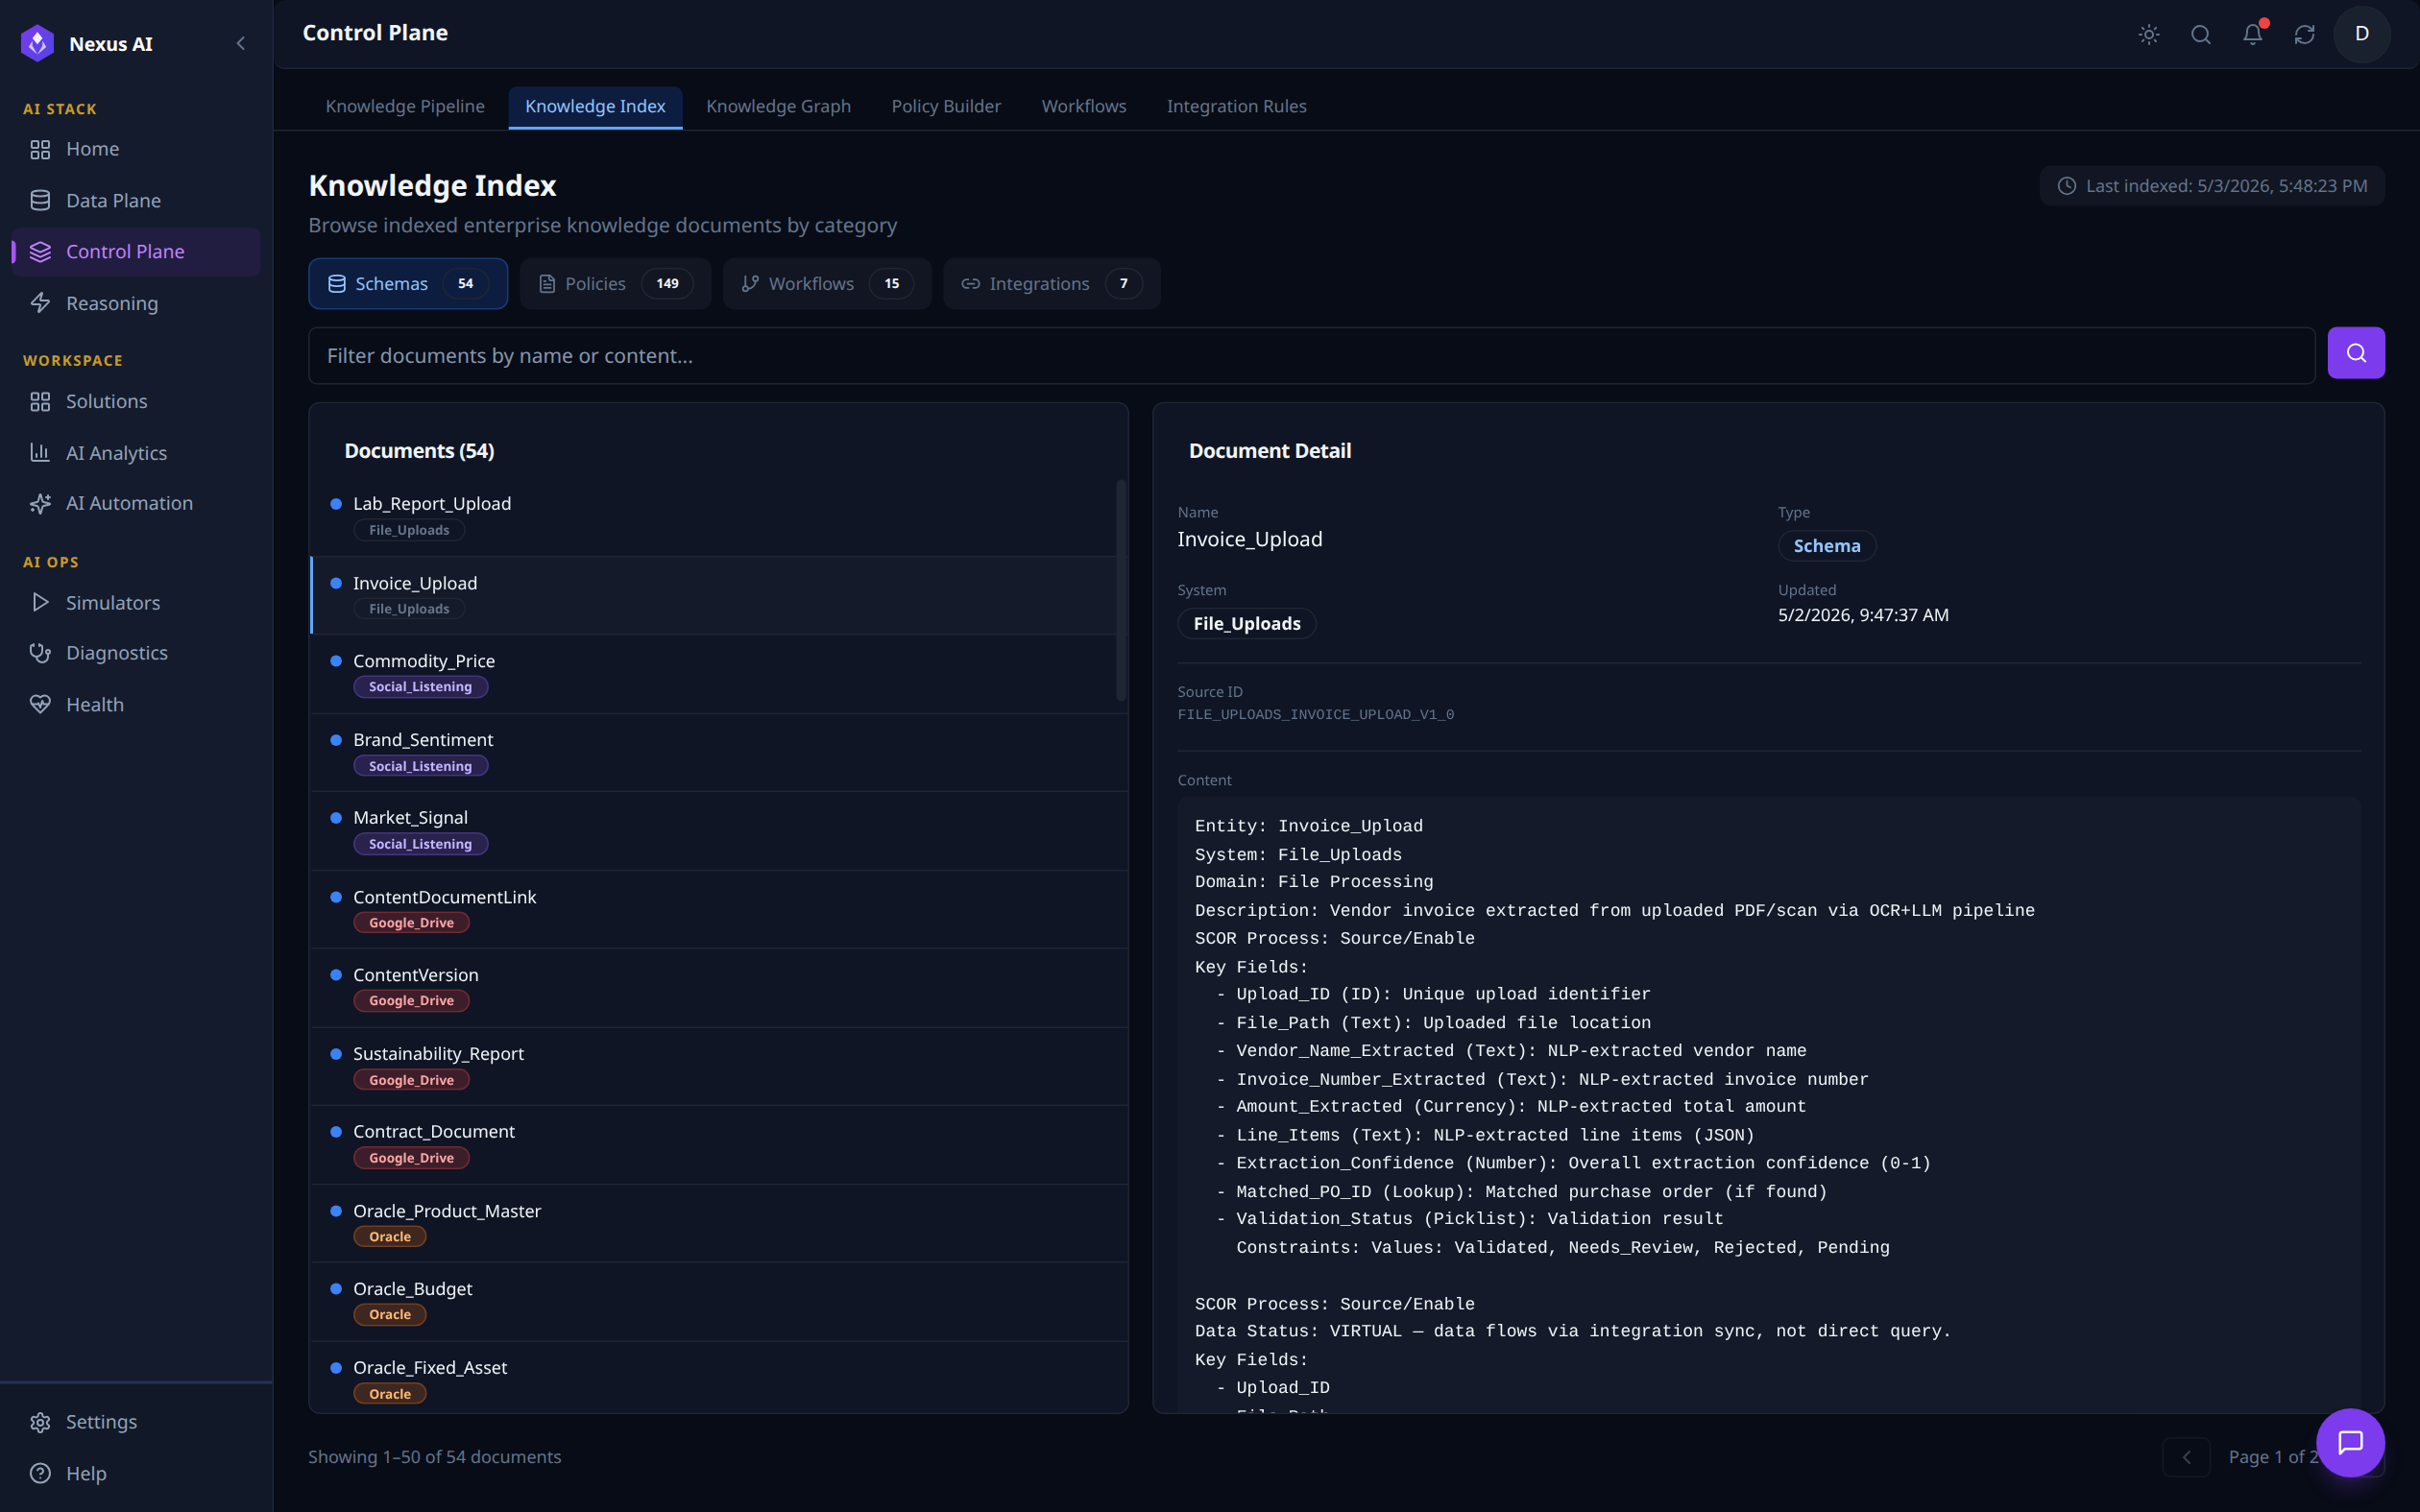
Search and browse interface for every document indexed by the platform. Filter chips swap between Schemas, Policies, Workflows, and Integrations. With Invoice_Upload selected here, the right pane shows the document's full metadata -- Name, Type, System, Updated timestamp, Source ID -- plus the canonical YAML body (Entity, Domain, Description, SCOR Process, Key Fields, etc.) that feeds the embedding pipeline.
Knowledge Graph
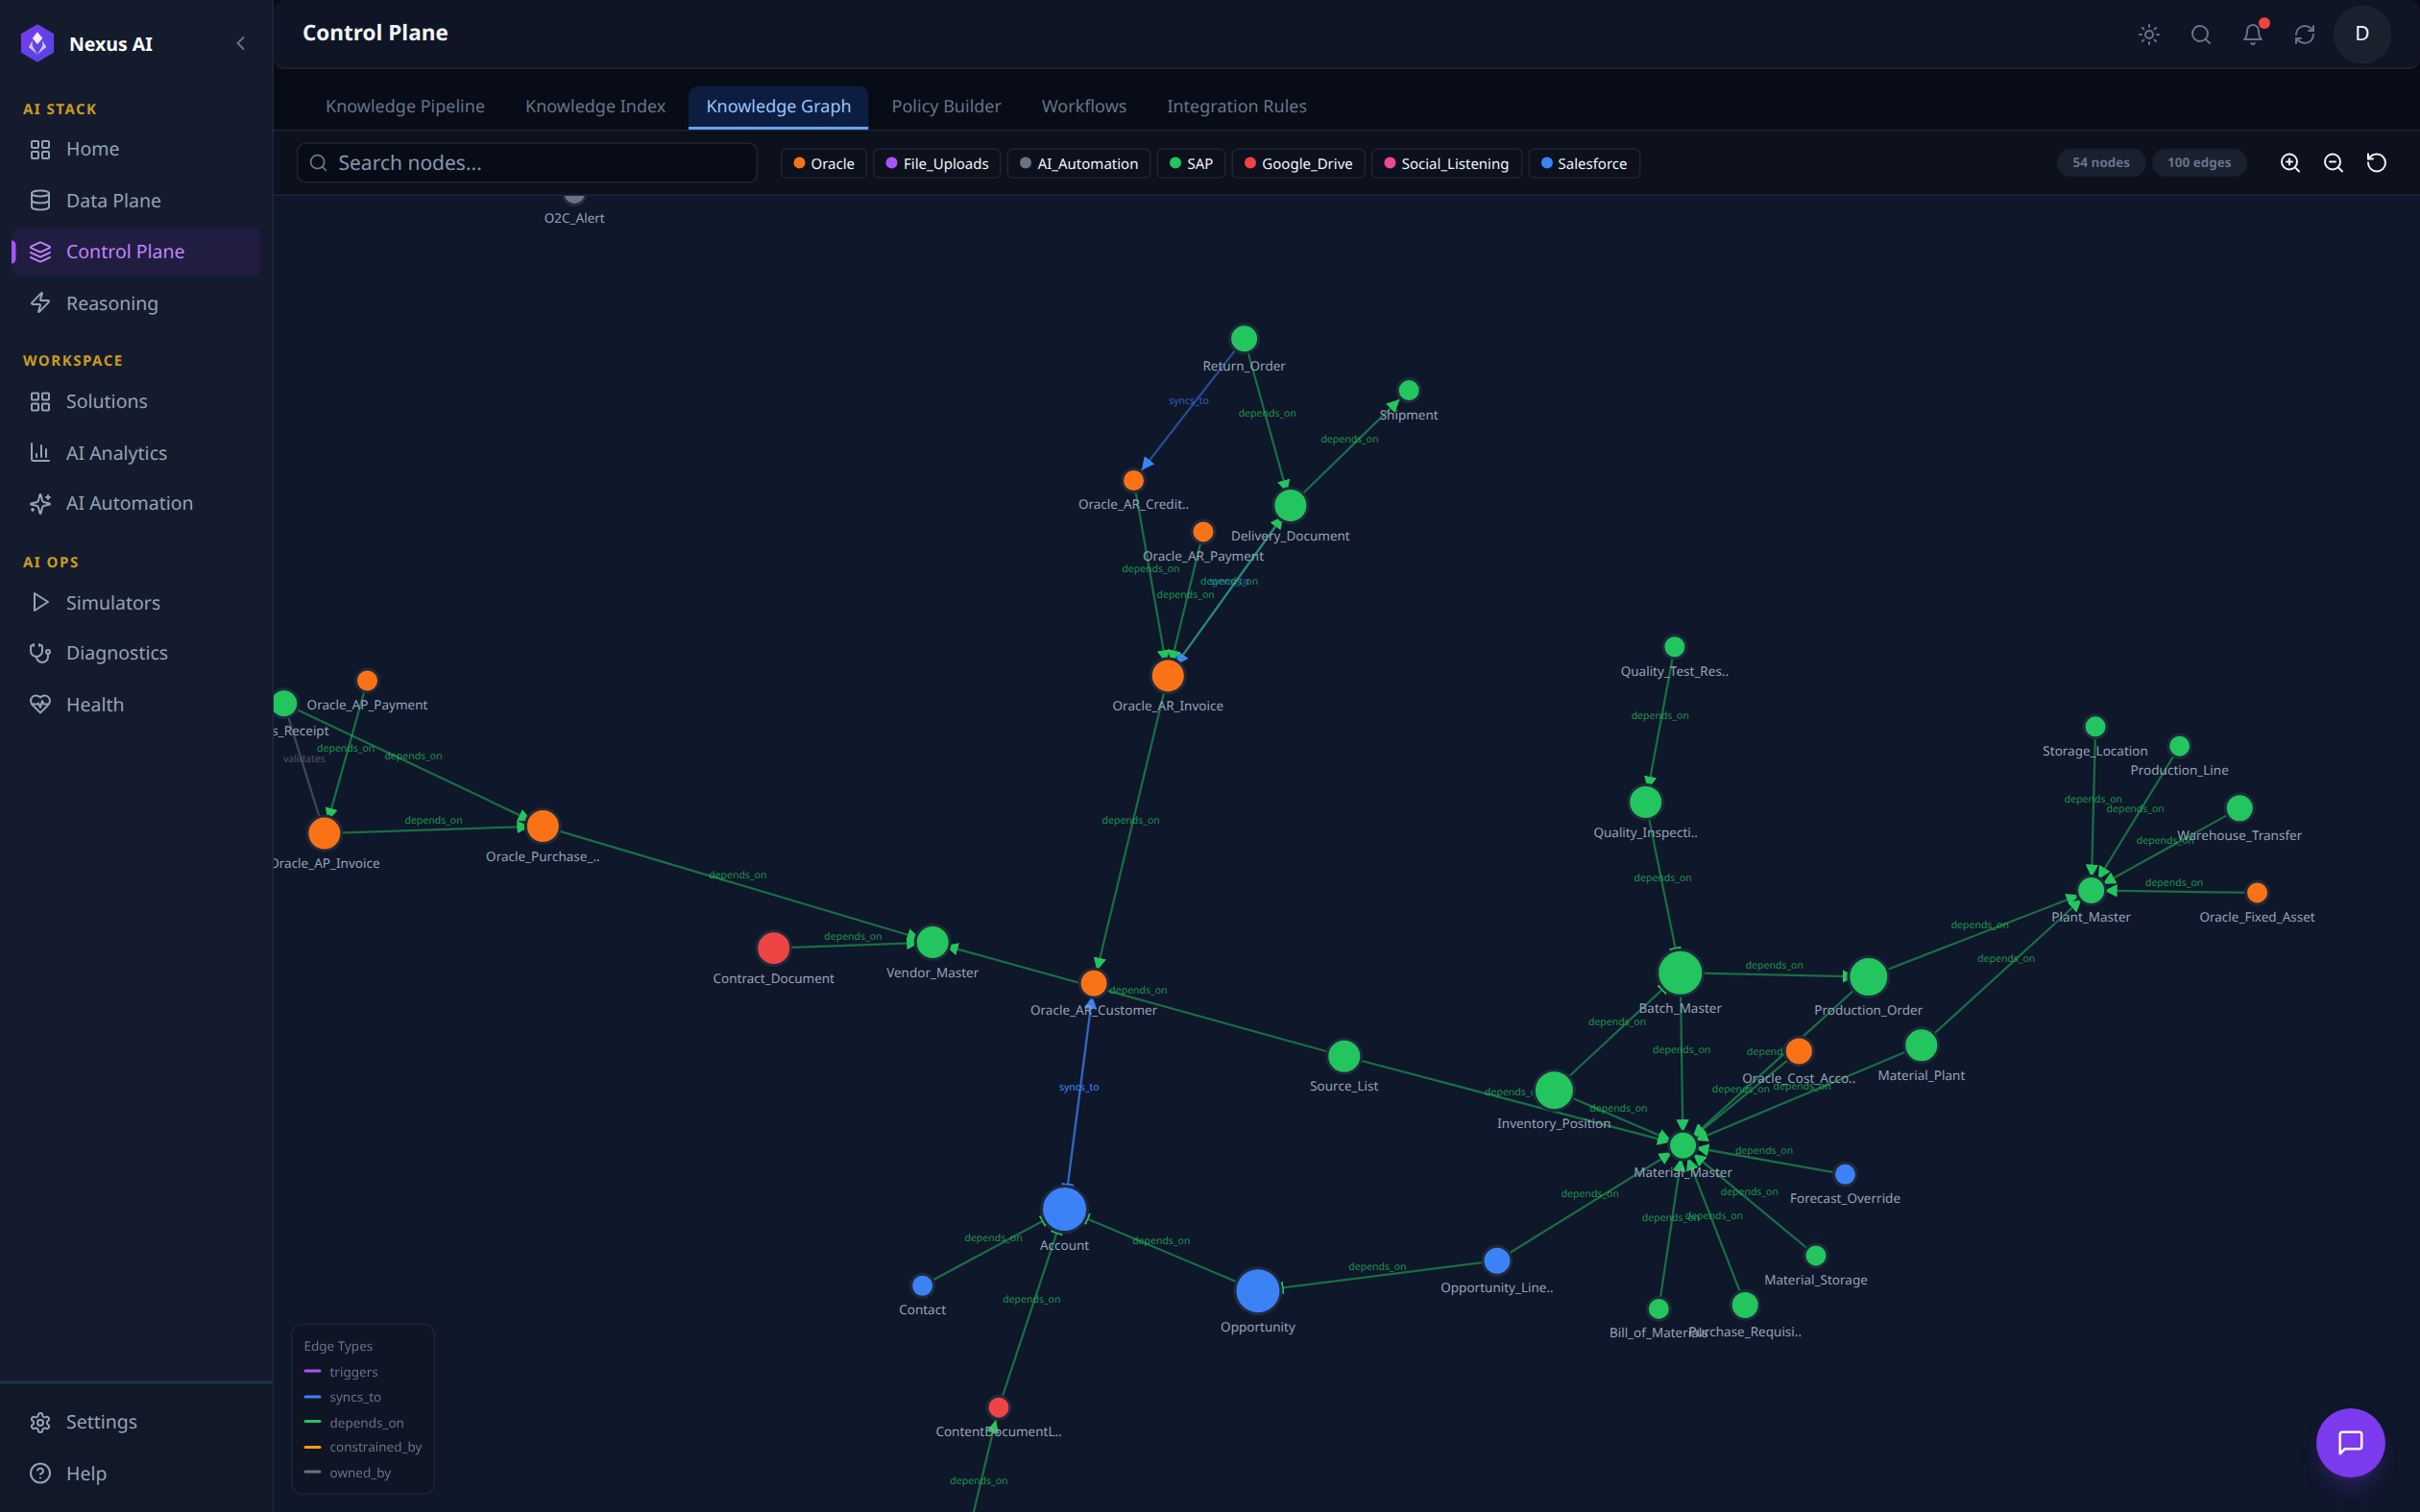
Interactive visualisation of the live ontology graph, 94 nodes / 100 edges in this view. Nodes are colour-coded by source system (Salesforce, Oracle, SAP, Google Drive, File Uploads, Social Listening, AI_Automation), and edges carry typed relationships (triggers, syncs_to, depends_on, constrained_by, owned_by). The toolbar offers full-text search and per-source filtering.
Policy Builder
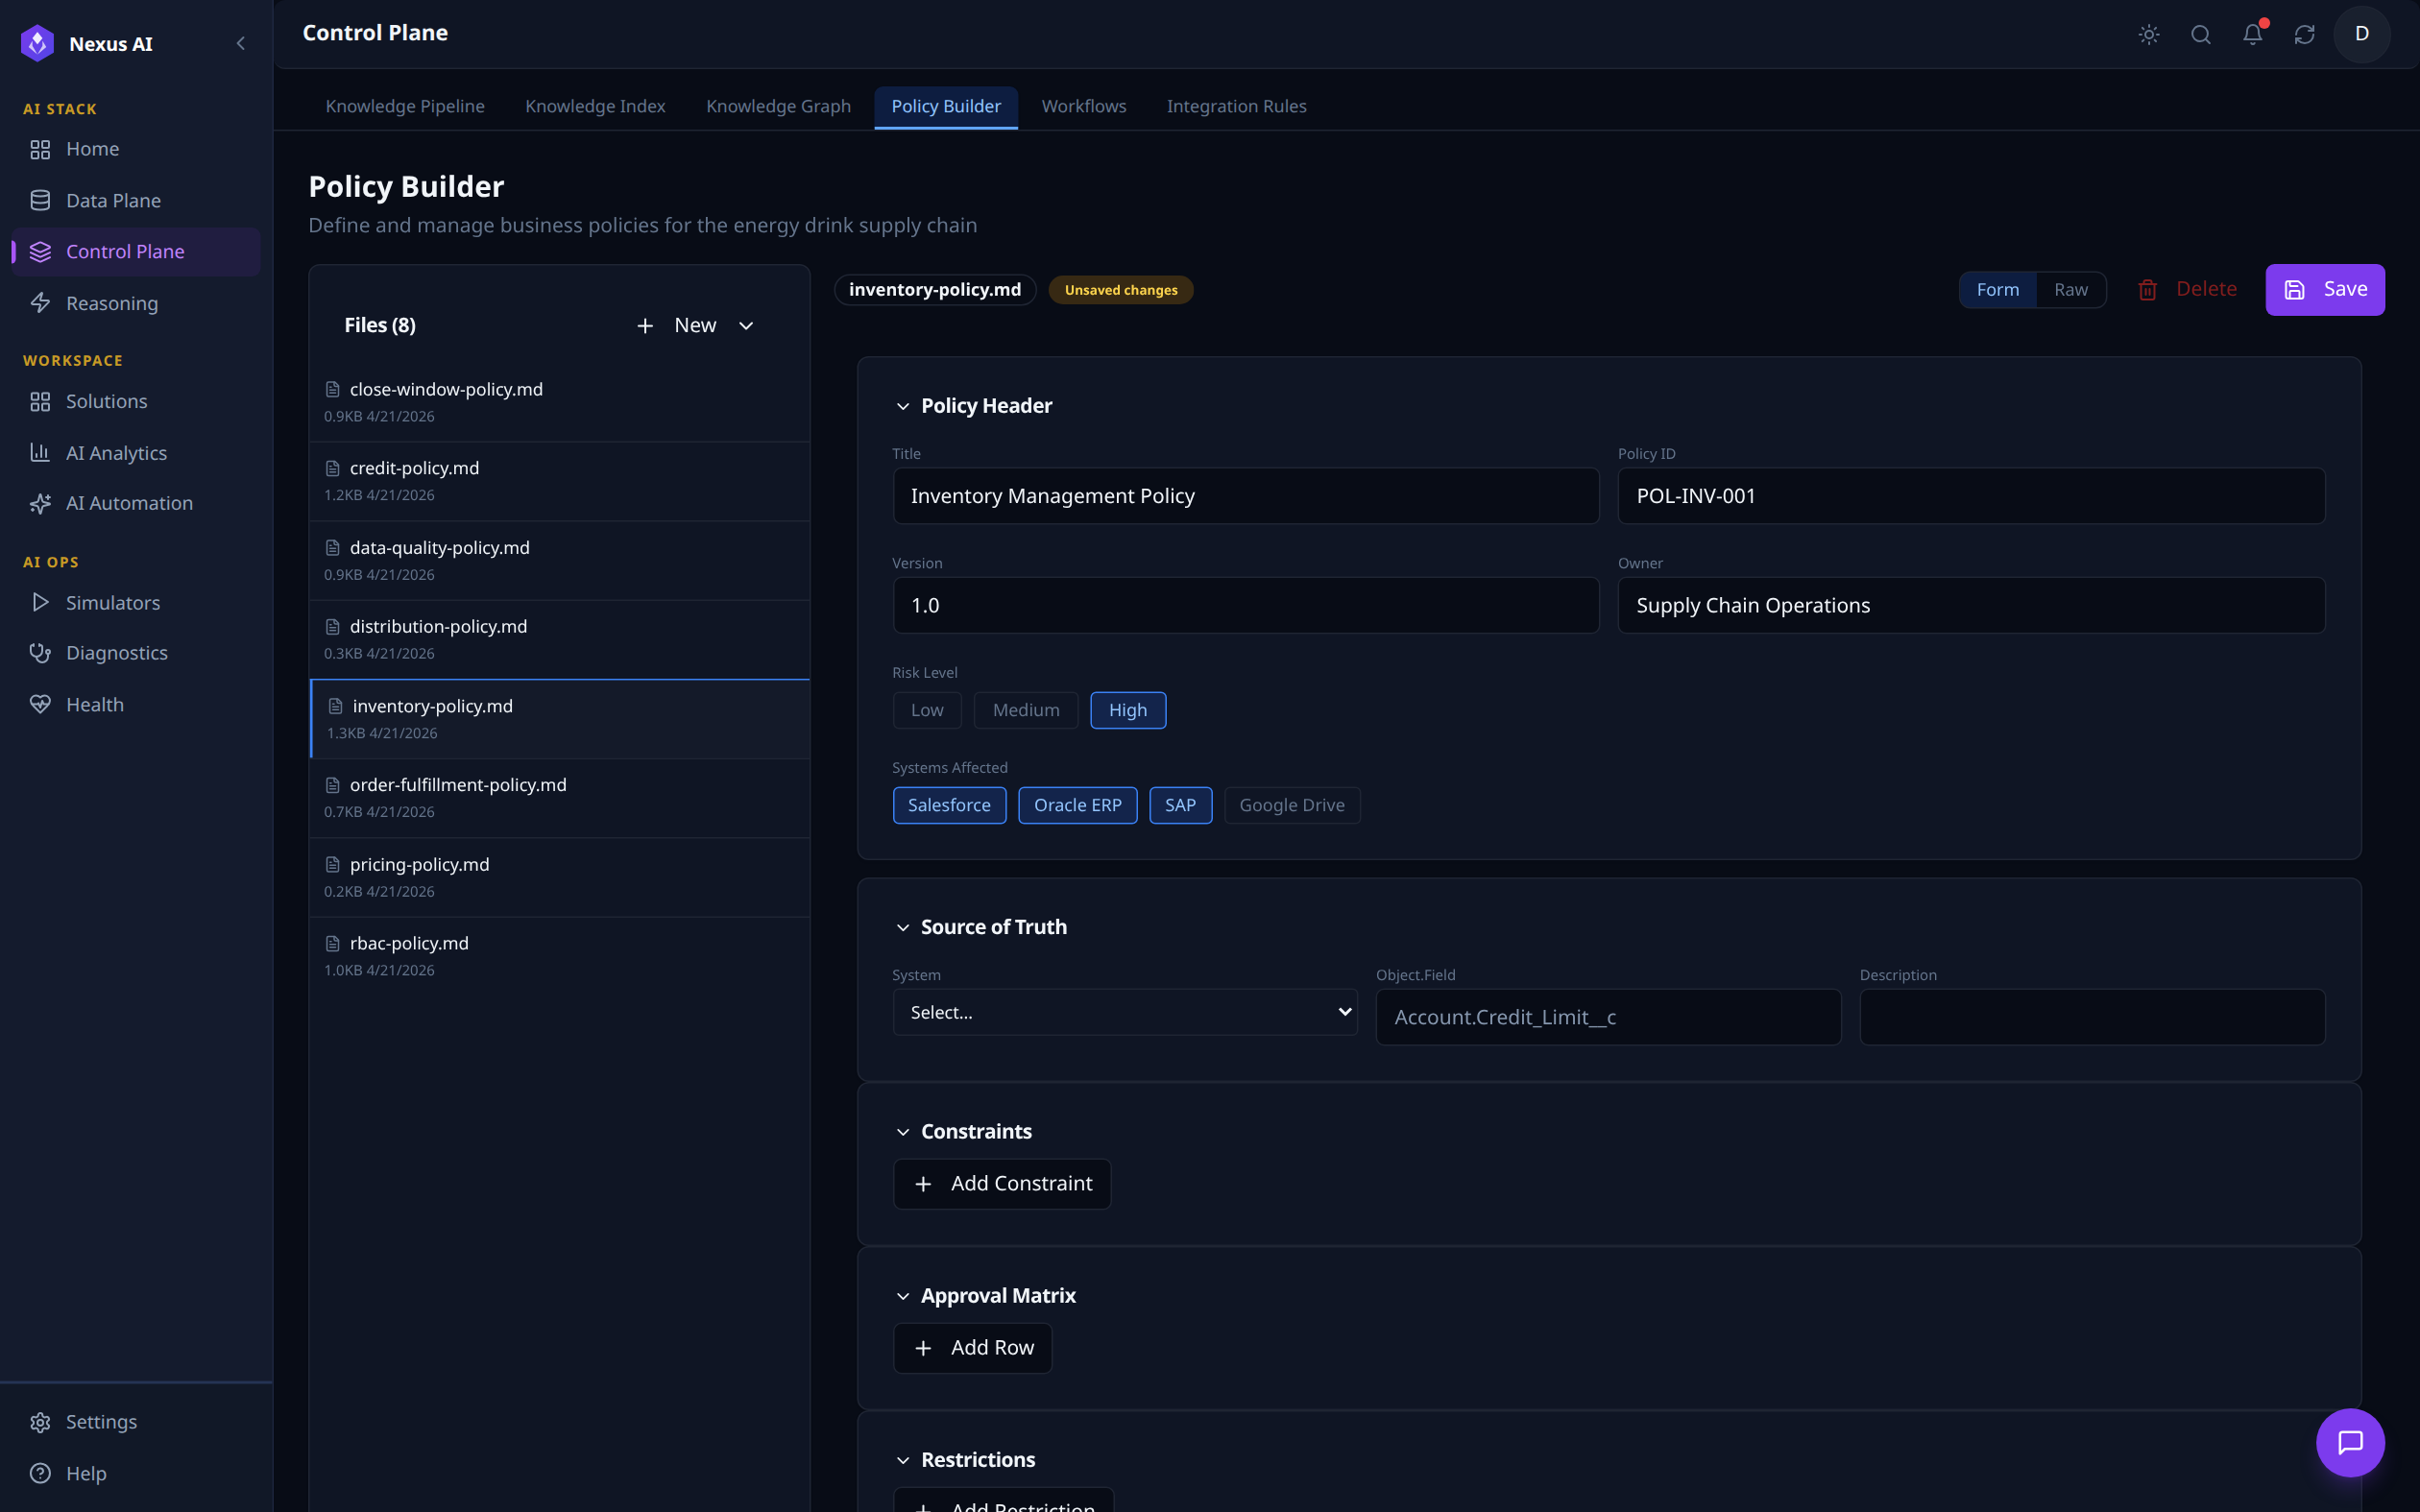
Visual editor for business policies stored as Markdown files. The left panel lists every policy in the bundle (8 in this view); selecting inventory-policy.md loads its Policy Header (Inventory Management Policy, ID POL-INV-001, Risk Level High, applied to Salesforce / Oracle ERP / SAP), Source of Truth binding (Account.Credit_Limit__c), and the editable Constraints, Approval Matrix, and Restrictions blocks.
Workflows
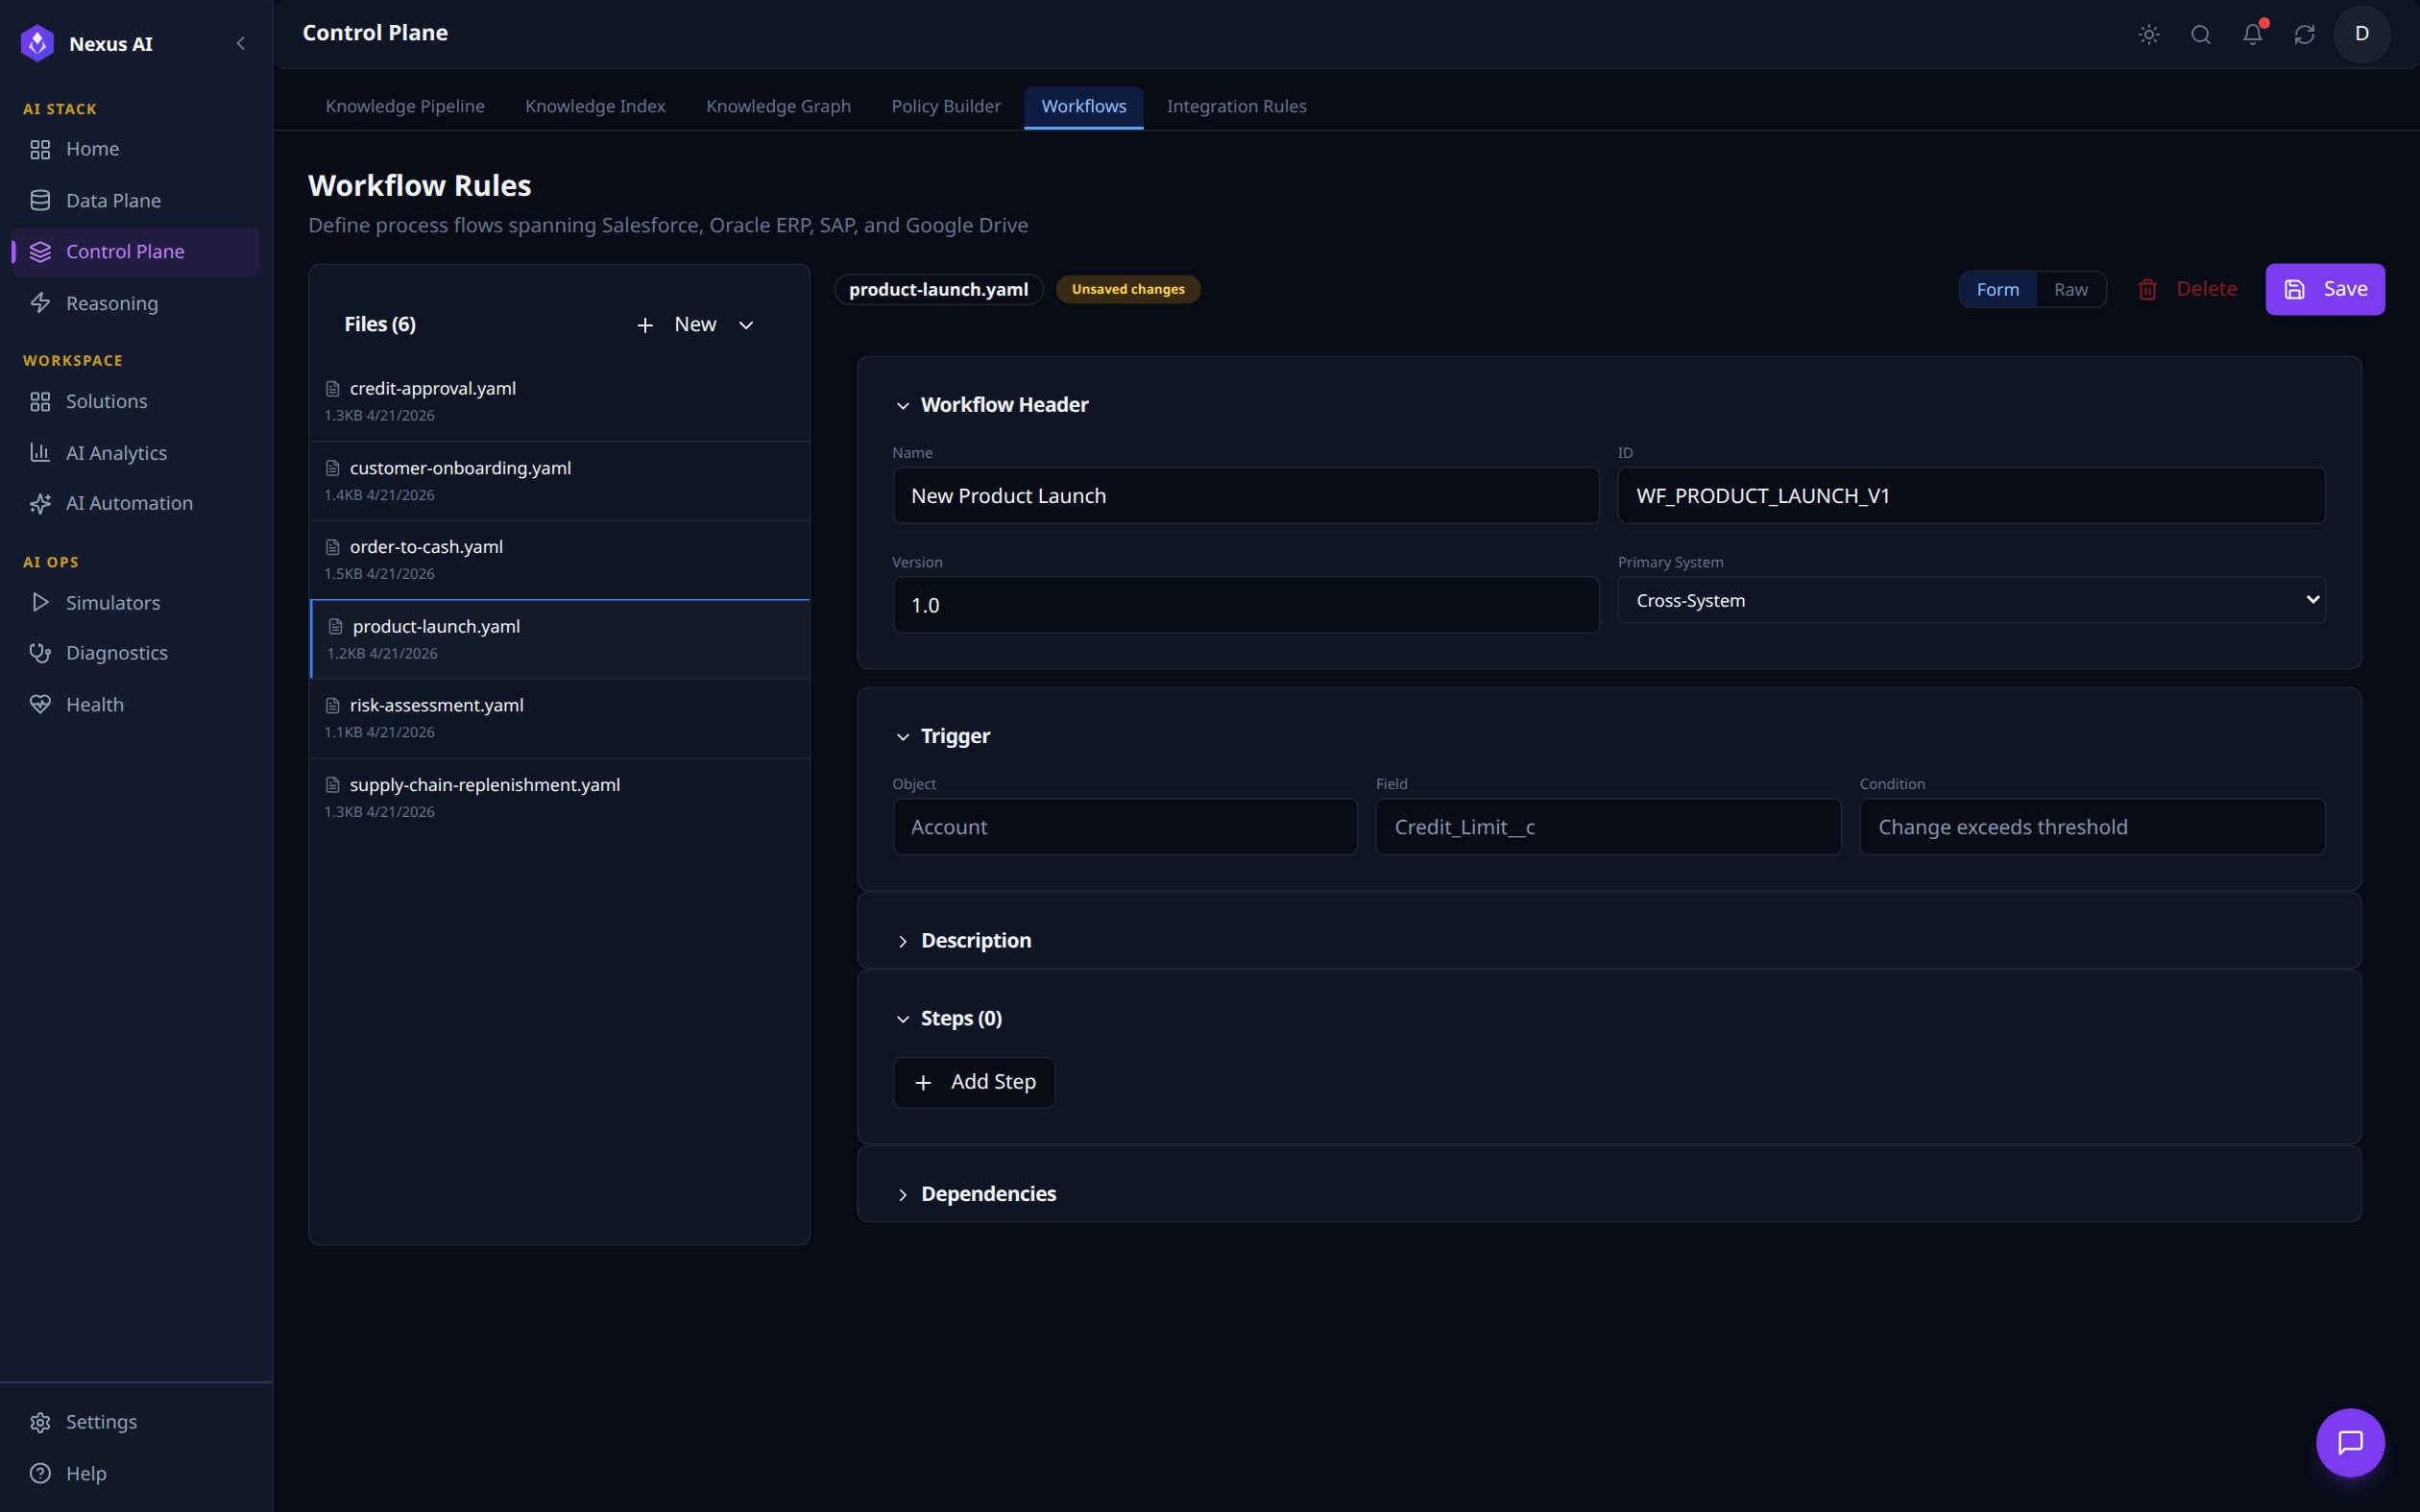
Visual editor for multi-system process flows stored as YAML. Files (6) lists the workflow templates; selecting product-launch.yaml loads its Workflow Header (New Product Launch, ID WF_PRODUCT_LAUNCH_V1, Primary System: Cross-System) and Trigger definition (Account.Credit_Limit__c change exceeds threshold). Description, Steps, and Dependencies sections are editable below.
Integration Rules
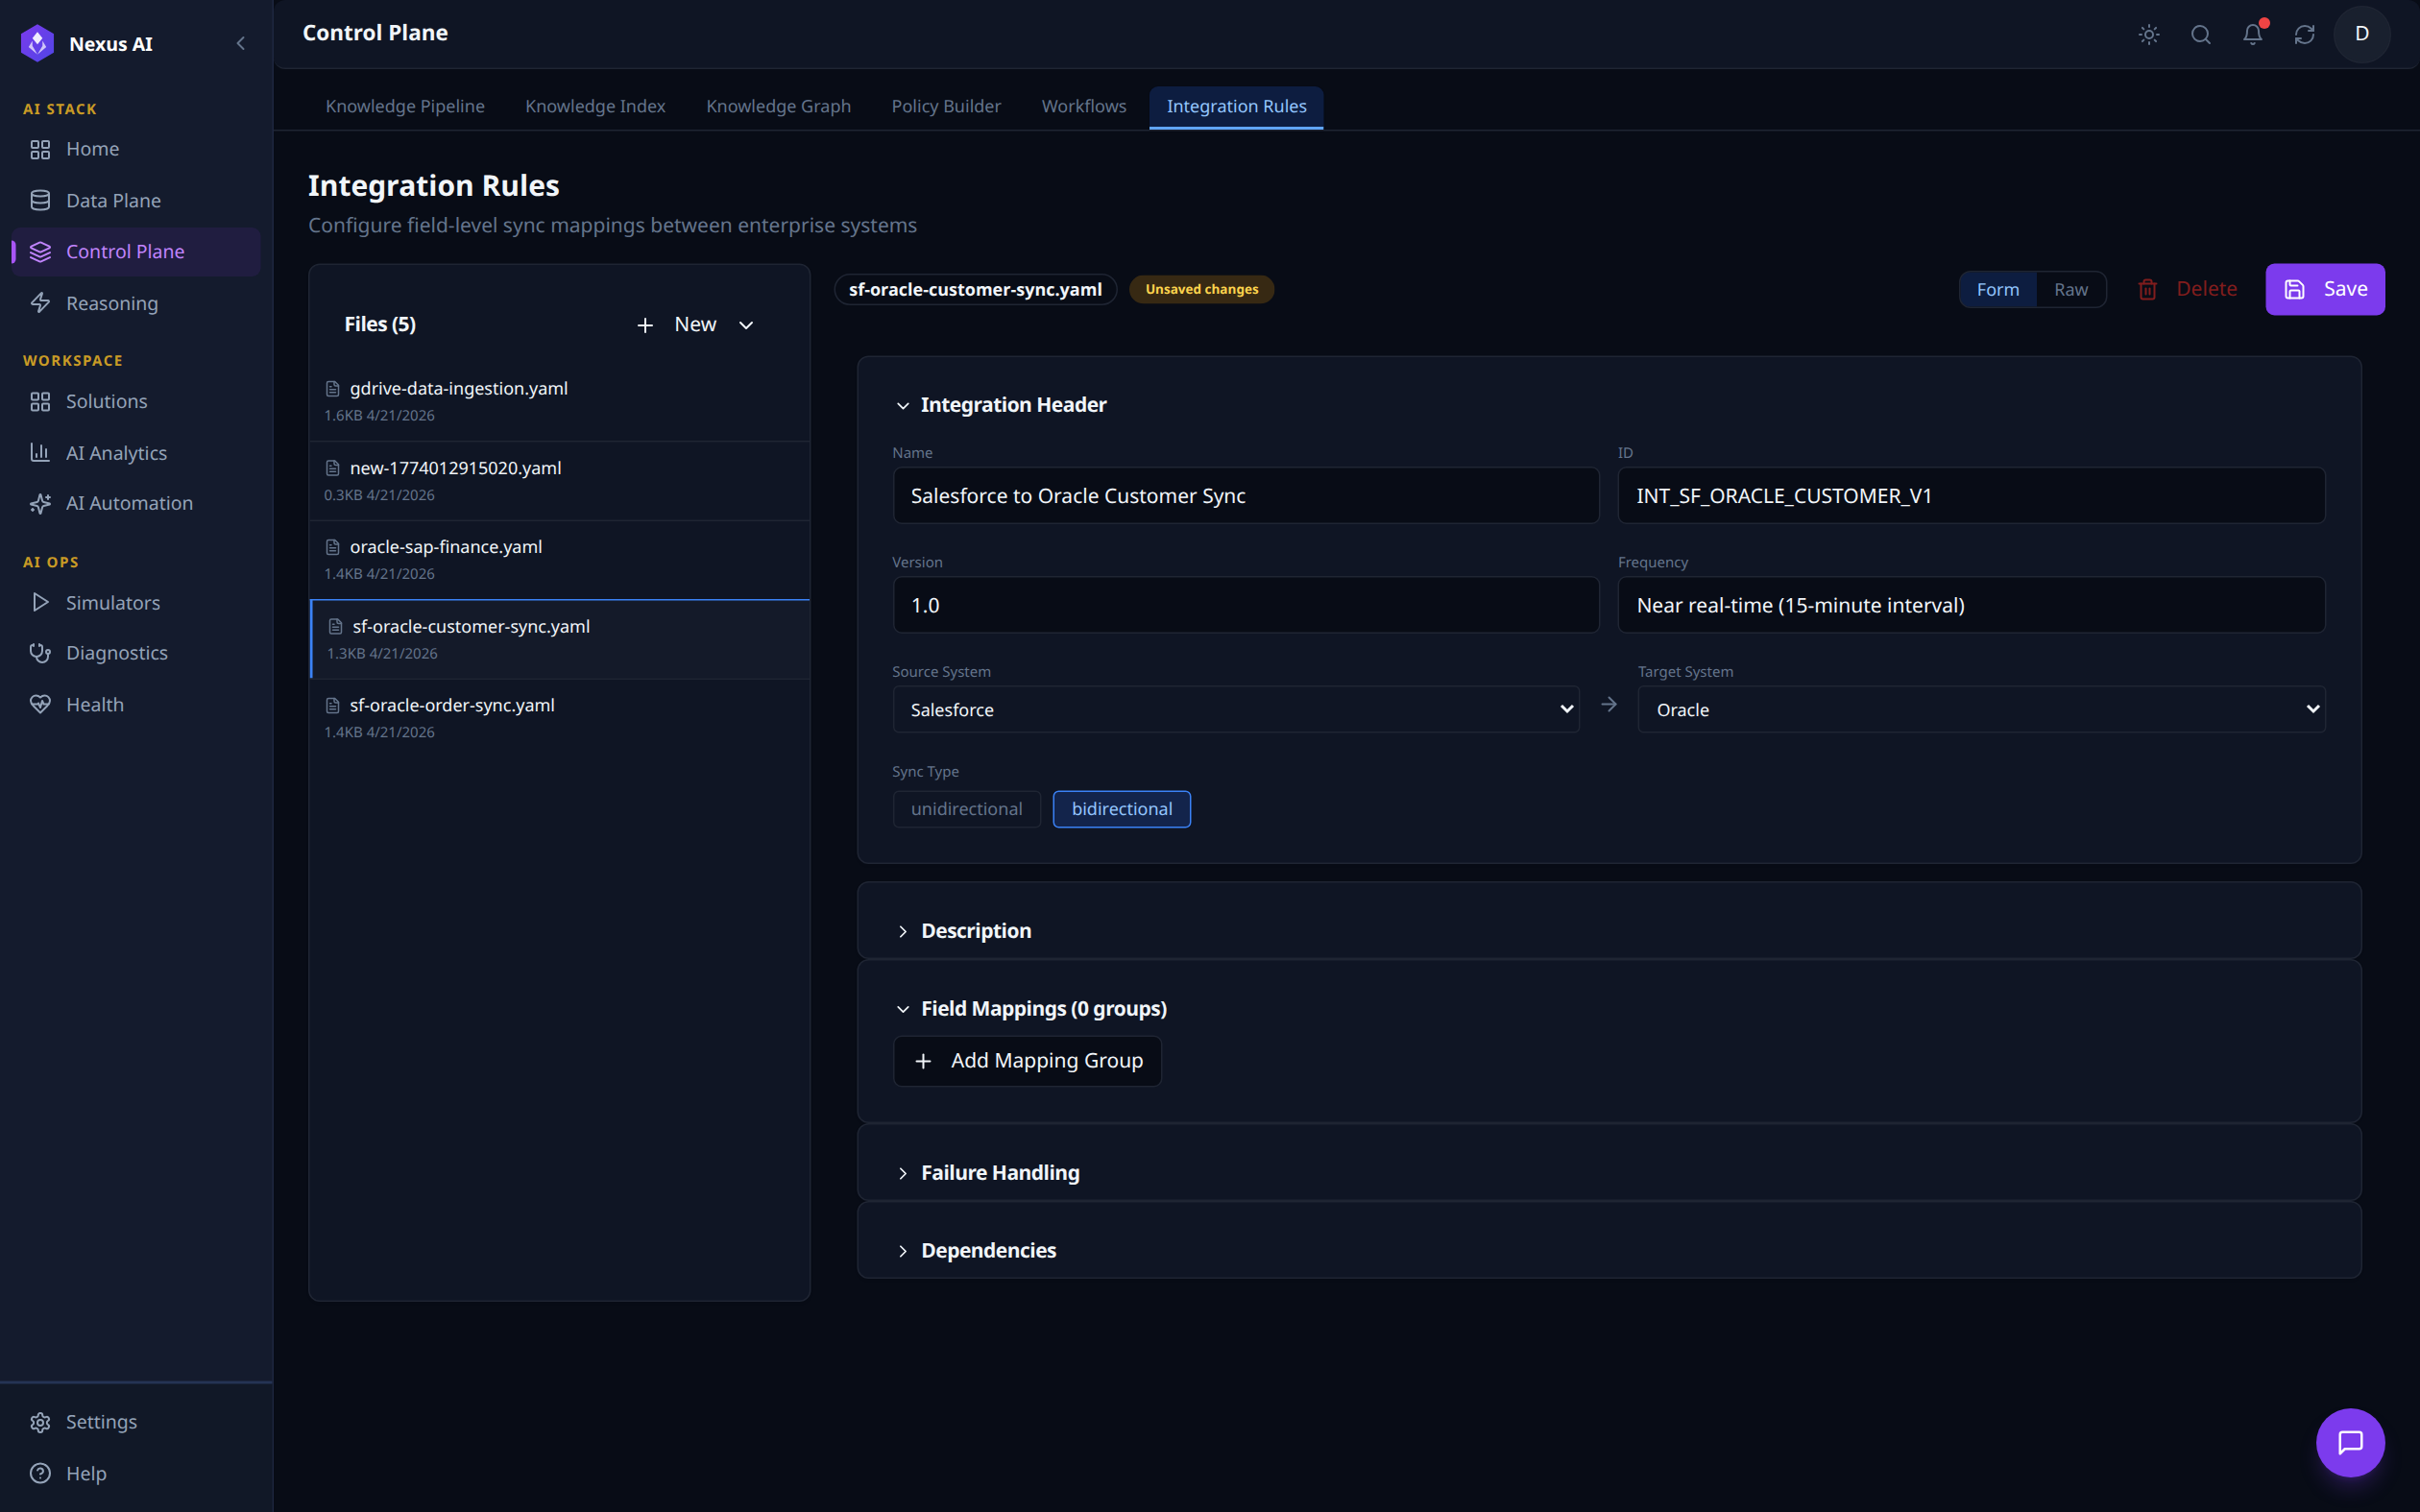
Configures field-level sync mappings between enterprise systems. Files (5) lists the sync rules; selecting sf-oracle-customer-sync.yaml loads its Integration Header (Salesforce to Oracle Customer Sync, ID INT_SF_ORACLE_CUSTOMER_V1, Frequency: near real-time 15-minute interval, bidirectional), with Source System Salesforce -> Target System Oracle wired up. Field Mappings, Failure Handling, and Dependencies are managed in the collapsible sections below.
Reasoning Plane
The Reasoning Plane is where AI reasons and acts on enterprise data. It uses a ReAct (Reason + Act) agent loop powered by LLMs, with registered tools that can query data, execute workflows, and interact with external systems -- all under policy guardrails.
Capabilities
| Component | Description |
|---|---|
| AI Copilot | Natural language interface for querying data, running analysis, and executing actions |
| ReAct Tools | Registered tool functions the AI can call (data queries, journey execution, log analysis, simulator control) |
| Planning Playground | RAG validation and testing environment for reasoning chains |
| Policy Guardrails | Pre-execution policy checks before any tool action is executed |
| Multi-system Orchestration | Coordinate actions across multiple enterprise systems in a single reasoning chain |
ReAct Loop
graph LR
    User["User Query"] --> Copilot["AI Copilot"]
    Copilot --> Reason["LLM Reasoning"]
    Reason --> Plan["Plan Actions"]
    Plan --> Policy["Policy Check"]
    Policy --> Execute["Execute Tool"]
    Execute --> Observe["Observe Result"]
    Observe --> Reason
    Execute --> Systems["Enterprise Systems"]
Registered Tools
| Tool | Purpose |
|---|---|
| Journey Tool | Execute and manage data processing journeys |
| Logs & Reports Tool | Query execution logs, generate reports |
| WXCC Simulator Tool | Control contact center test data simulation |
| Data Plane Queries | Query virtual entities across connected systems |
| Ontology Queries | Search knowledge graph and semantic index |
Console Walkthrough
The Reasoning Plane is exposed through four tabs in the NexusAI workspace, covering interactive copilot use, RAG validation, the tool registry, and custom tool authoring.
AI Copilot
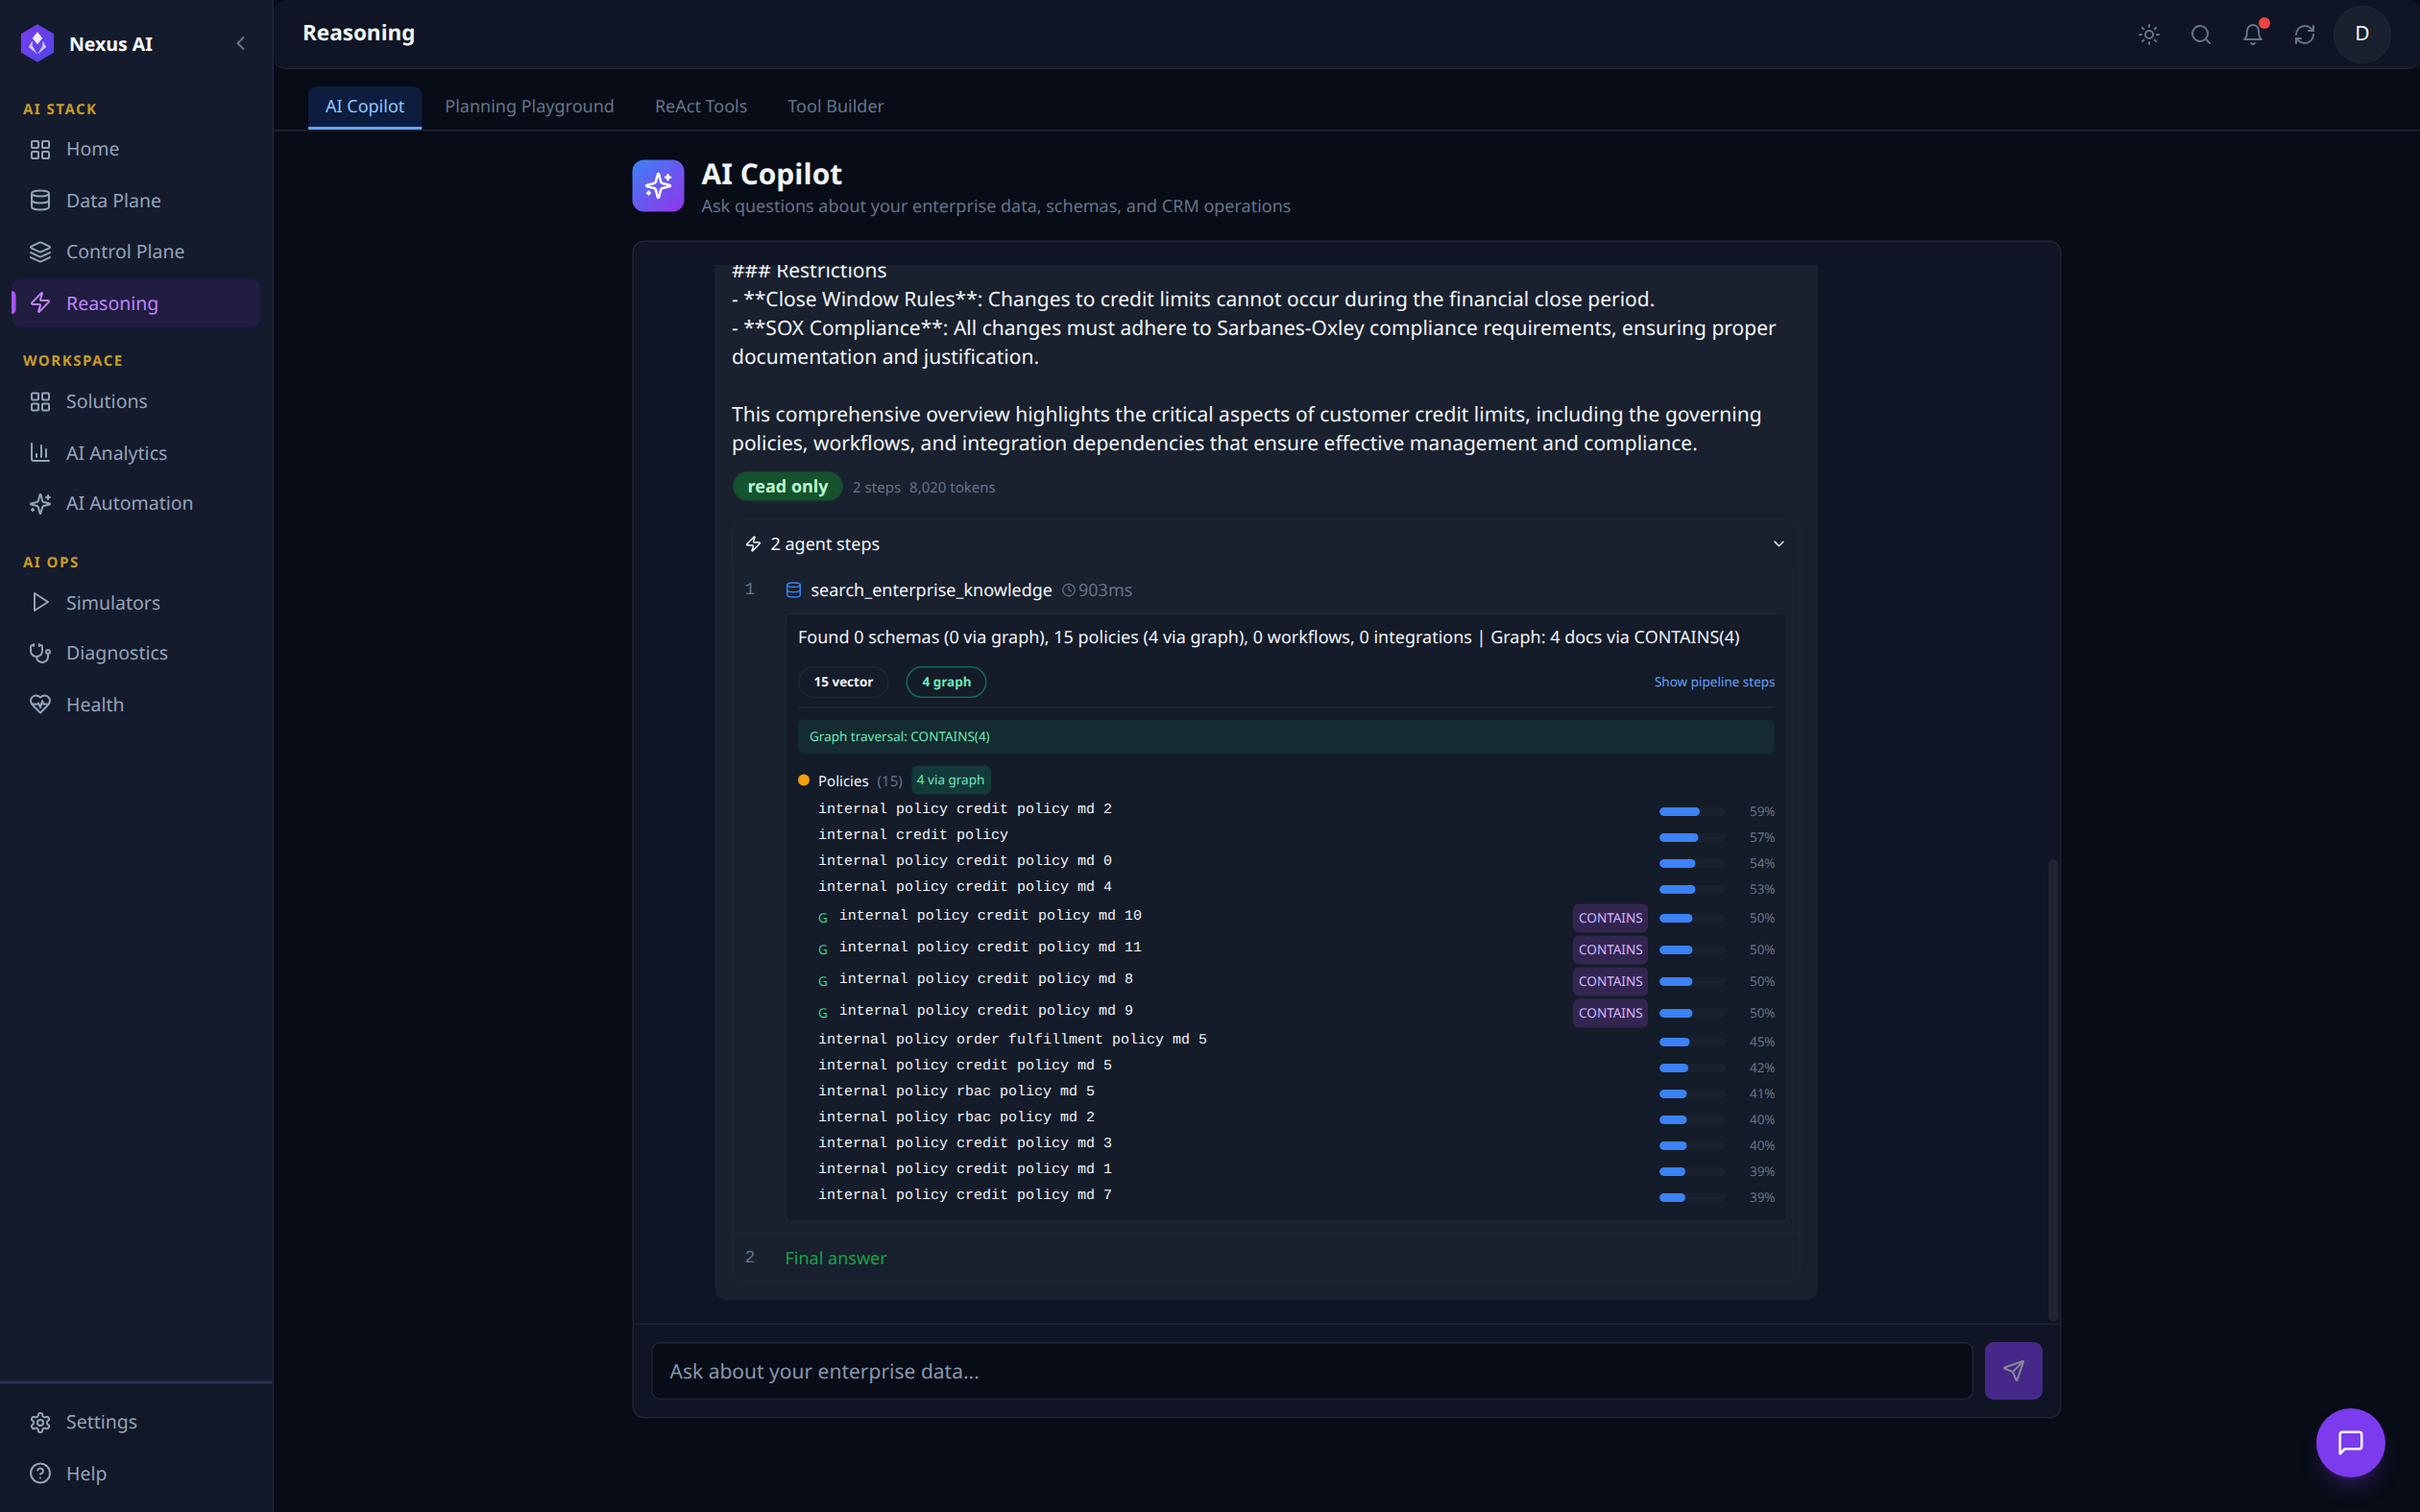
A conversational interface to the ReAct planning engine. The user submits a natural-language question -- here, "Which system is the source of truth for customer credit limits and what policies govern it?" -- and the agent returns a markdown reply followed by an inspectable, expandable 2 agent steps card. Step 1 shows the actual tool call: search_enterprise_knowledge (903 ms) returning 15 vector + 4 graph hits across credit / order-fulfilment / RBAC policies via the CONTAINS graph traversal, with relevance scores per document. Step 2 is the Final answer. The read only badge and token count (8,020 tokens) are surfaced for traceability.
Planning Playground
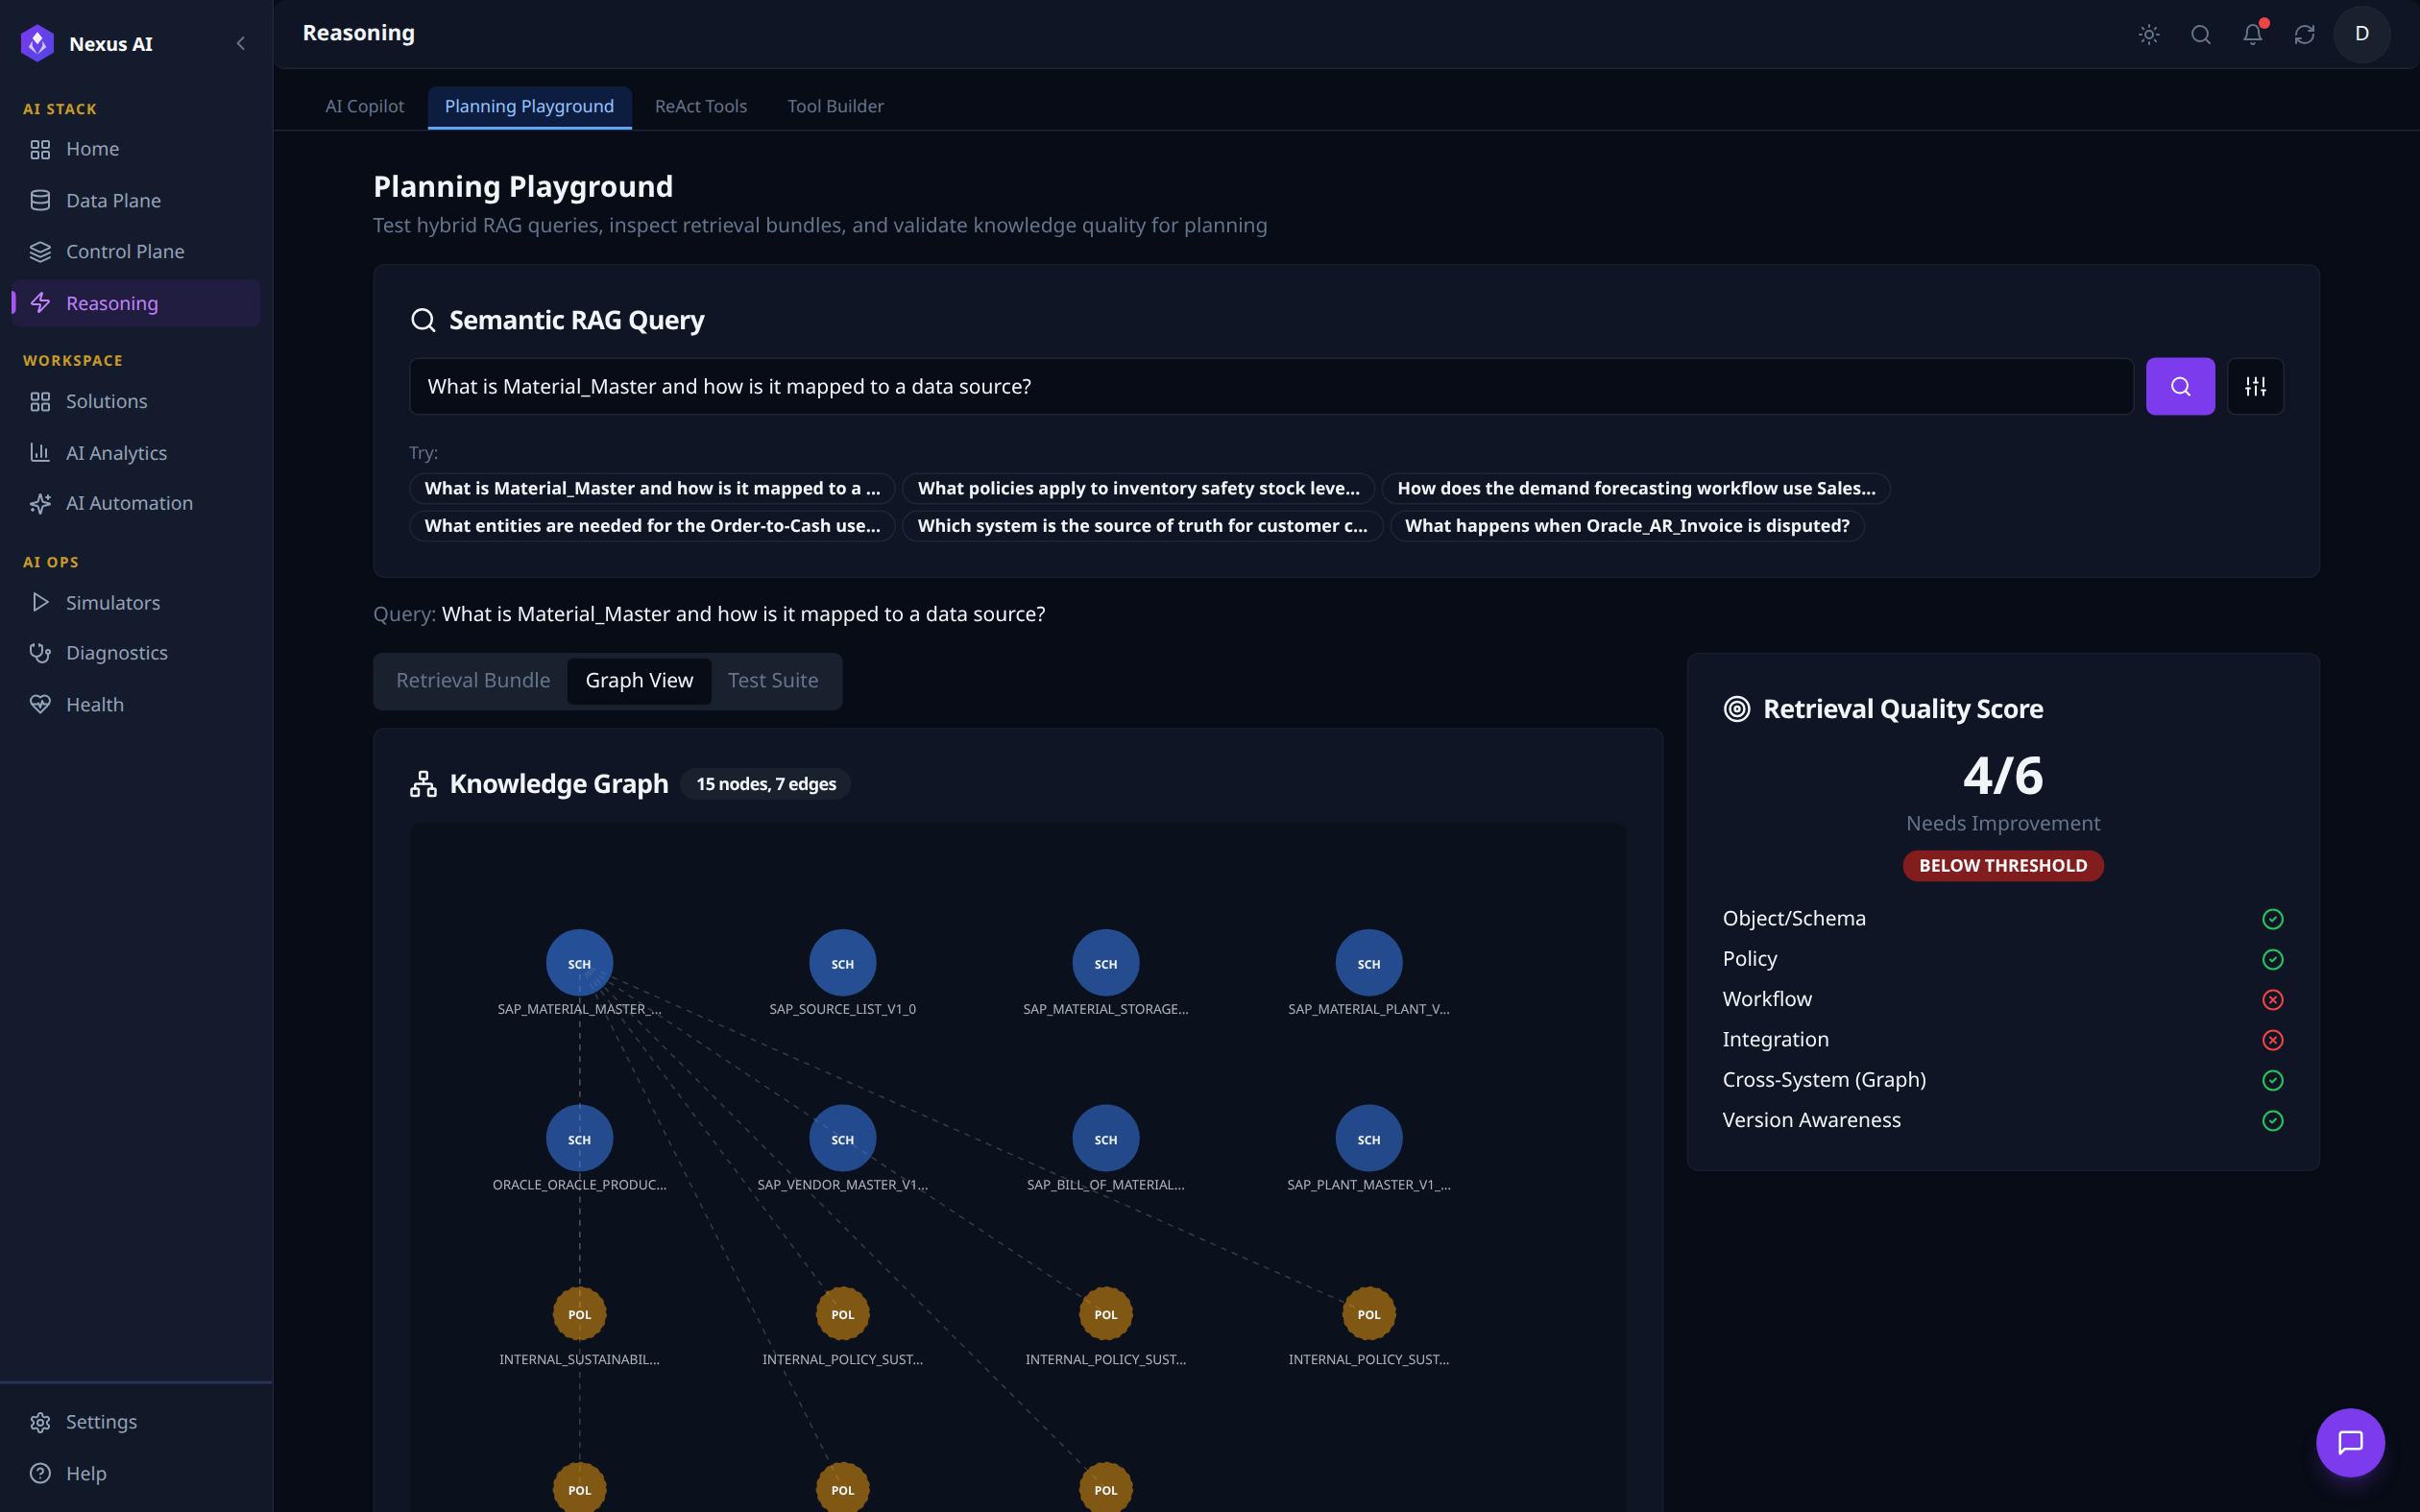
Hybrid RAG testing environment. The query "What is Material_Master and how is it mapped to a data source?" is run from the Semantic RAG Query input (with quick-fill chips for common scenarios). Below, the Retrieval Bundle / Graph View / Test Suite tabs let you inspect what was retrieved -- the Graph View here renders a 15-node, 7-edge subgraph mixing schema and policy nodes. The right-hand Retrieval Quality Score scores the bundle 4 / 6 (Below Threshold) with a per-dimension breakdown (Object/Schema, Policy, Cross-System Graph, Version Awareness all pass; Workflow and Integration fail) so engineers can iterate on the bundle before promoting it.
ReAct Tools
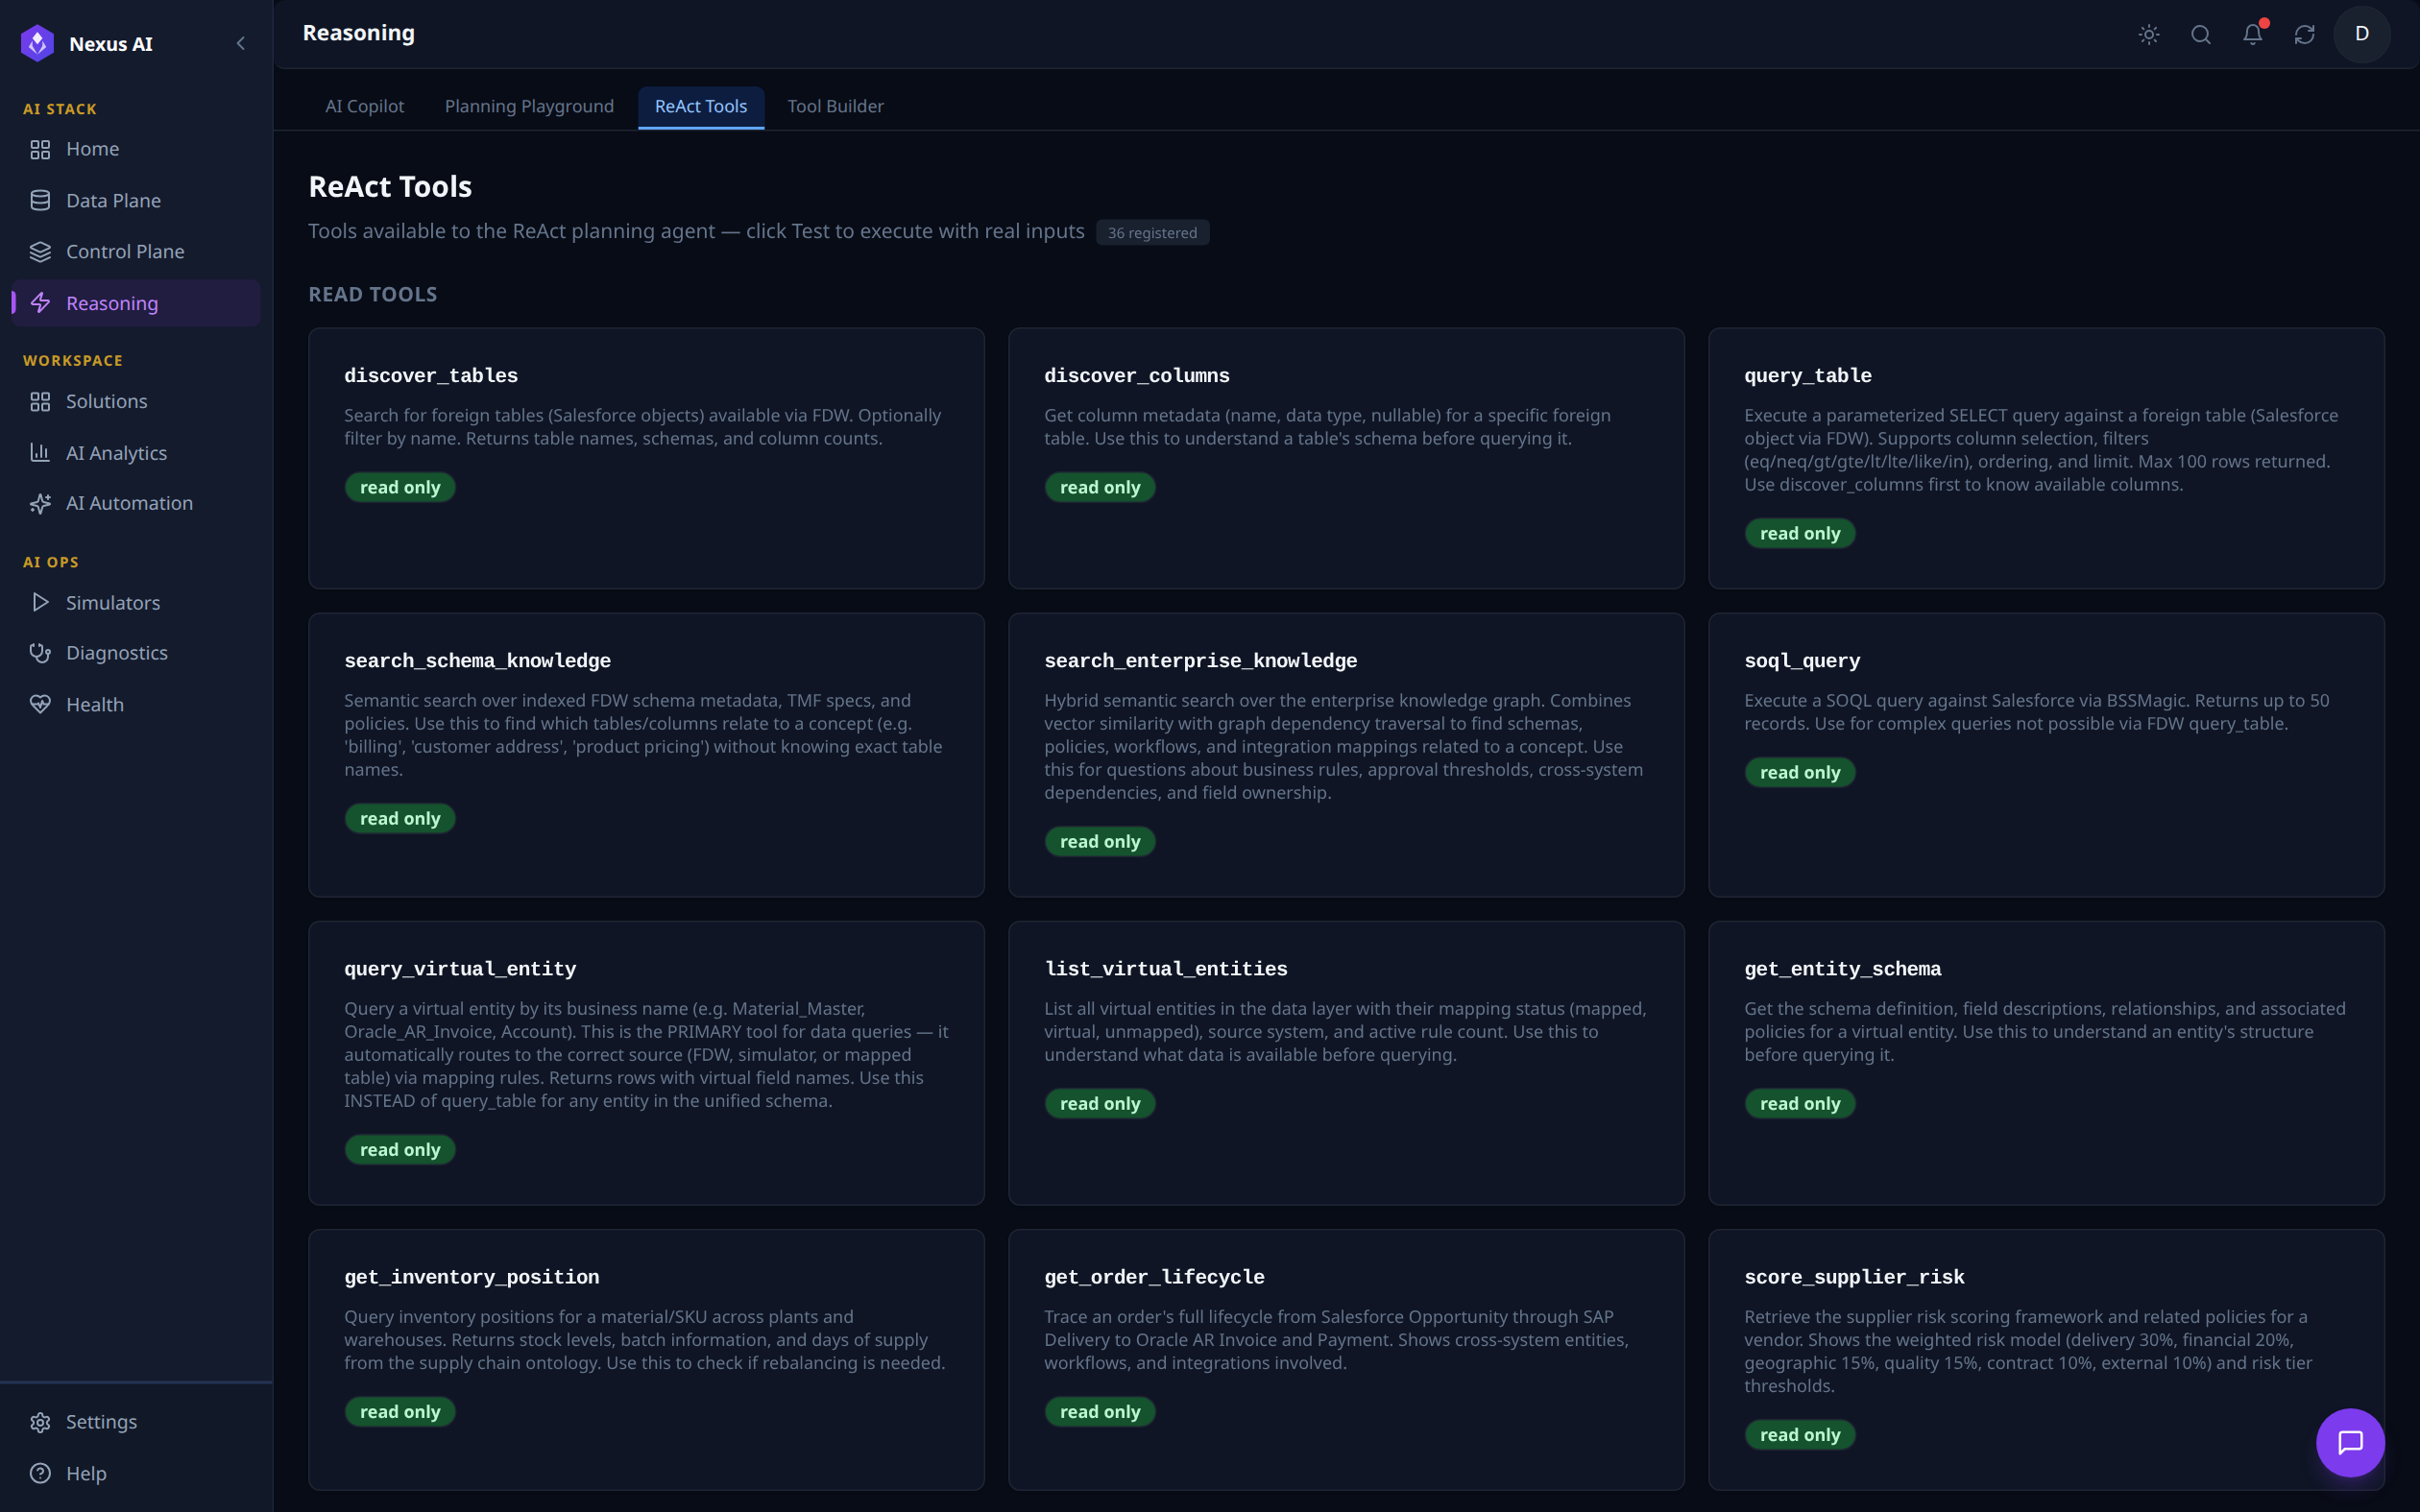
Catalogue of all 36 registered tools the planning agent can call. Each card describes a tool's purpose and tags it as read only or write-capable. Visible read-only tools here include discover_tables, discover_columns, query_table, search_schema_knowledge, search_enterprise_knowledge, soql_query, query_virtual_entity, list_virtual_entities, get_entity_schema, get_inventory_position, get_order_lifecycle, and score_supplier_risk.
Tool Builder
Authoring surface for adding custom tools to the ReAct planning engine -- currently labelled coming soon.
Solutions
The Solutions layer is the app catalogue that sits on top of the three planes. Each Solution is a pre-built, vertical-aligned enterprise application powered by the Semantic Ontology Layer -- it bundles the entities, KPIs, dashboards, and journeys needed to operate one slice of the business end-to-end.
Capabilities
| Component | Description |
|---|---|
| Solution Card | Self-contained application with name, description, setup time, entity count, KPI targets, and source-data dependencies |
| Vertical Filter | Quick filter chips by domain (Finance, Planning, Operations, Risk, Revenue, ESG) |
| Priority Badge | Rollout priority (P0, P1) -- which solutions to deploy first |
| KPI Targets | Headline metrics each solution moves (e.g., DSO < 35 days, MAPE < 15%, OEE > 85%) |
| Source Data Tags | Which ontology entities the solution consumes (e.g., Opportunity, Material Master, Vendor Master) |
| Open App | One-click launch into the solution's workspace, where its mapped Views become the left navigation |
Solutions Walkthrough
The Solutions section is exposed as a catalogue view of all available enterprise apps, plus a per-Solution drill-down workspace reached via the Open App action on each card.
Solutions Catalogue
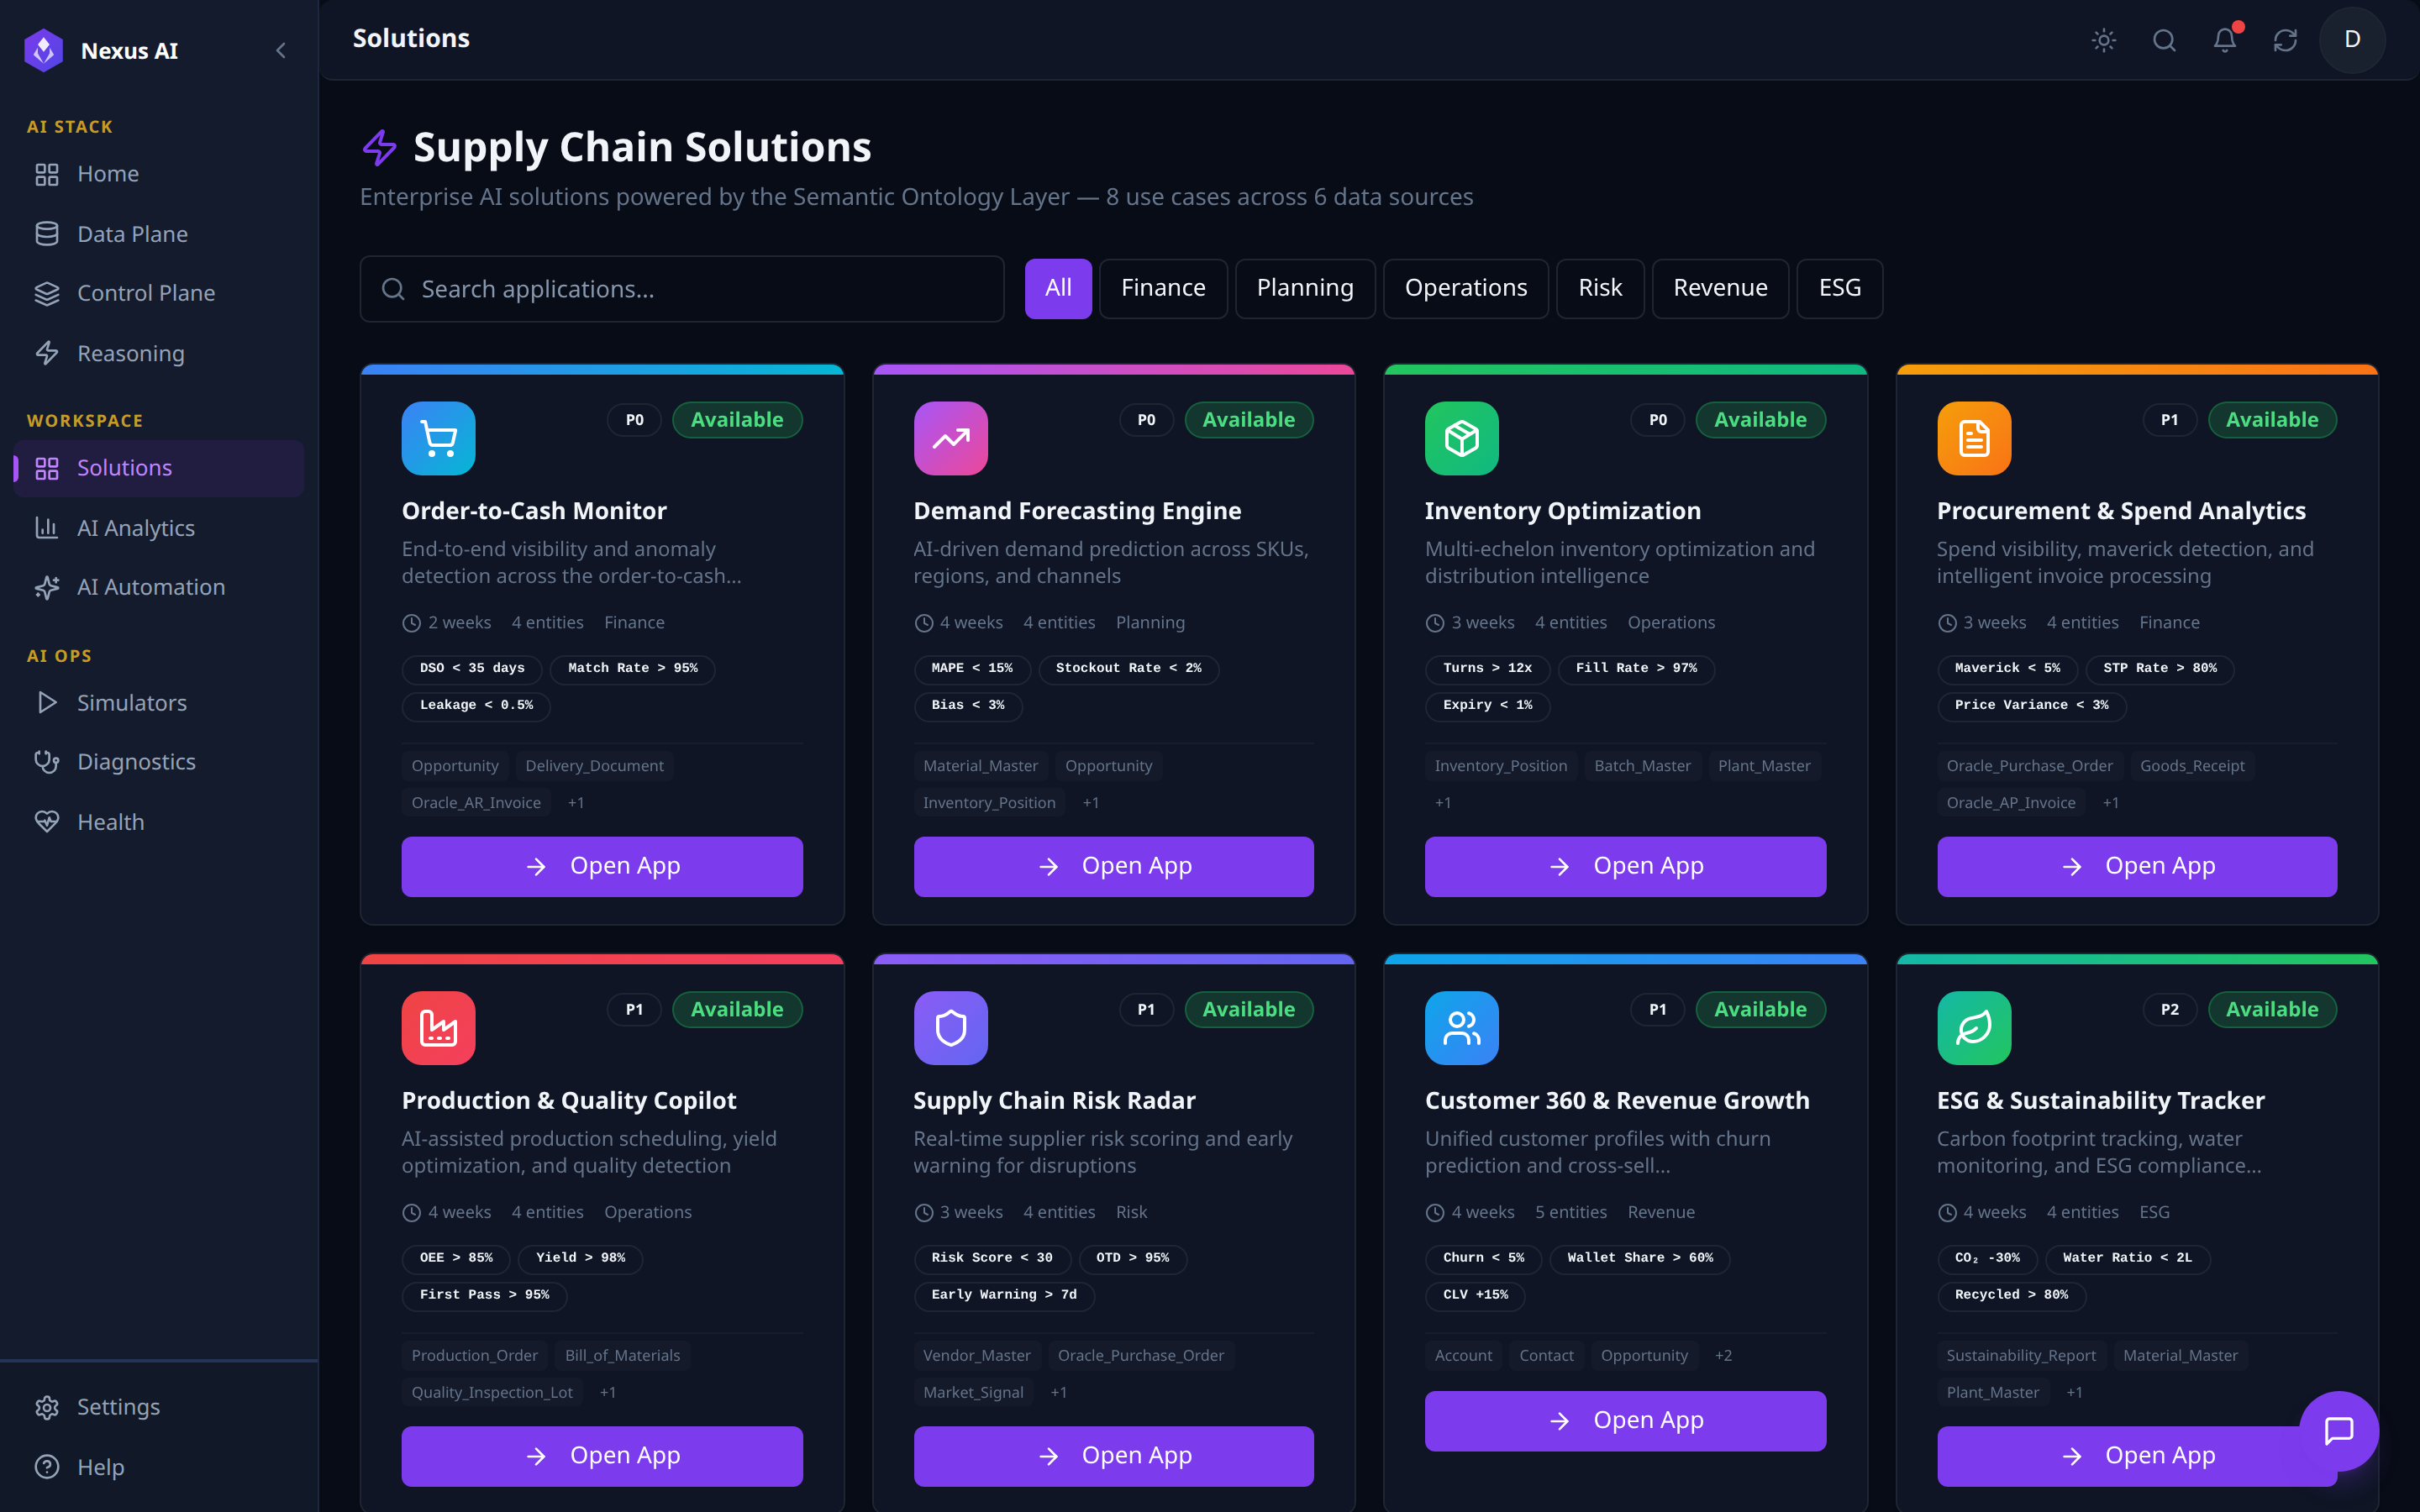
One-page catalogue of pre-built enterprise apps powered by the Semantic Ontology Layer.
- Filter -- vertical chips (Finance, Planning, Operations, Risk, Revenue, ESG) plus free-text search.
- Card metadata -- icon, priority (P0 / P1),
Availablestatus, setup time, entity count, headline KPI targets, source-entity chips. - Open App -- launches the solution's workspace, where its mapped Views become the left navigation.
Solution App -- Order-to-Cash Monitor (example)
Each Solution opens into a dedicated workspace with a left nav grouped into Analytics, Views, and Workspace, plus a top-level Manage Views / Run Journey action bar. Order-to-Cash Monitor below is the canonical example -- every Solution follows the same shell, parameterised by its ontology entities, KPI targets, and journeys.
Analytics -- Business Insights (the Solution home)
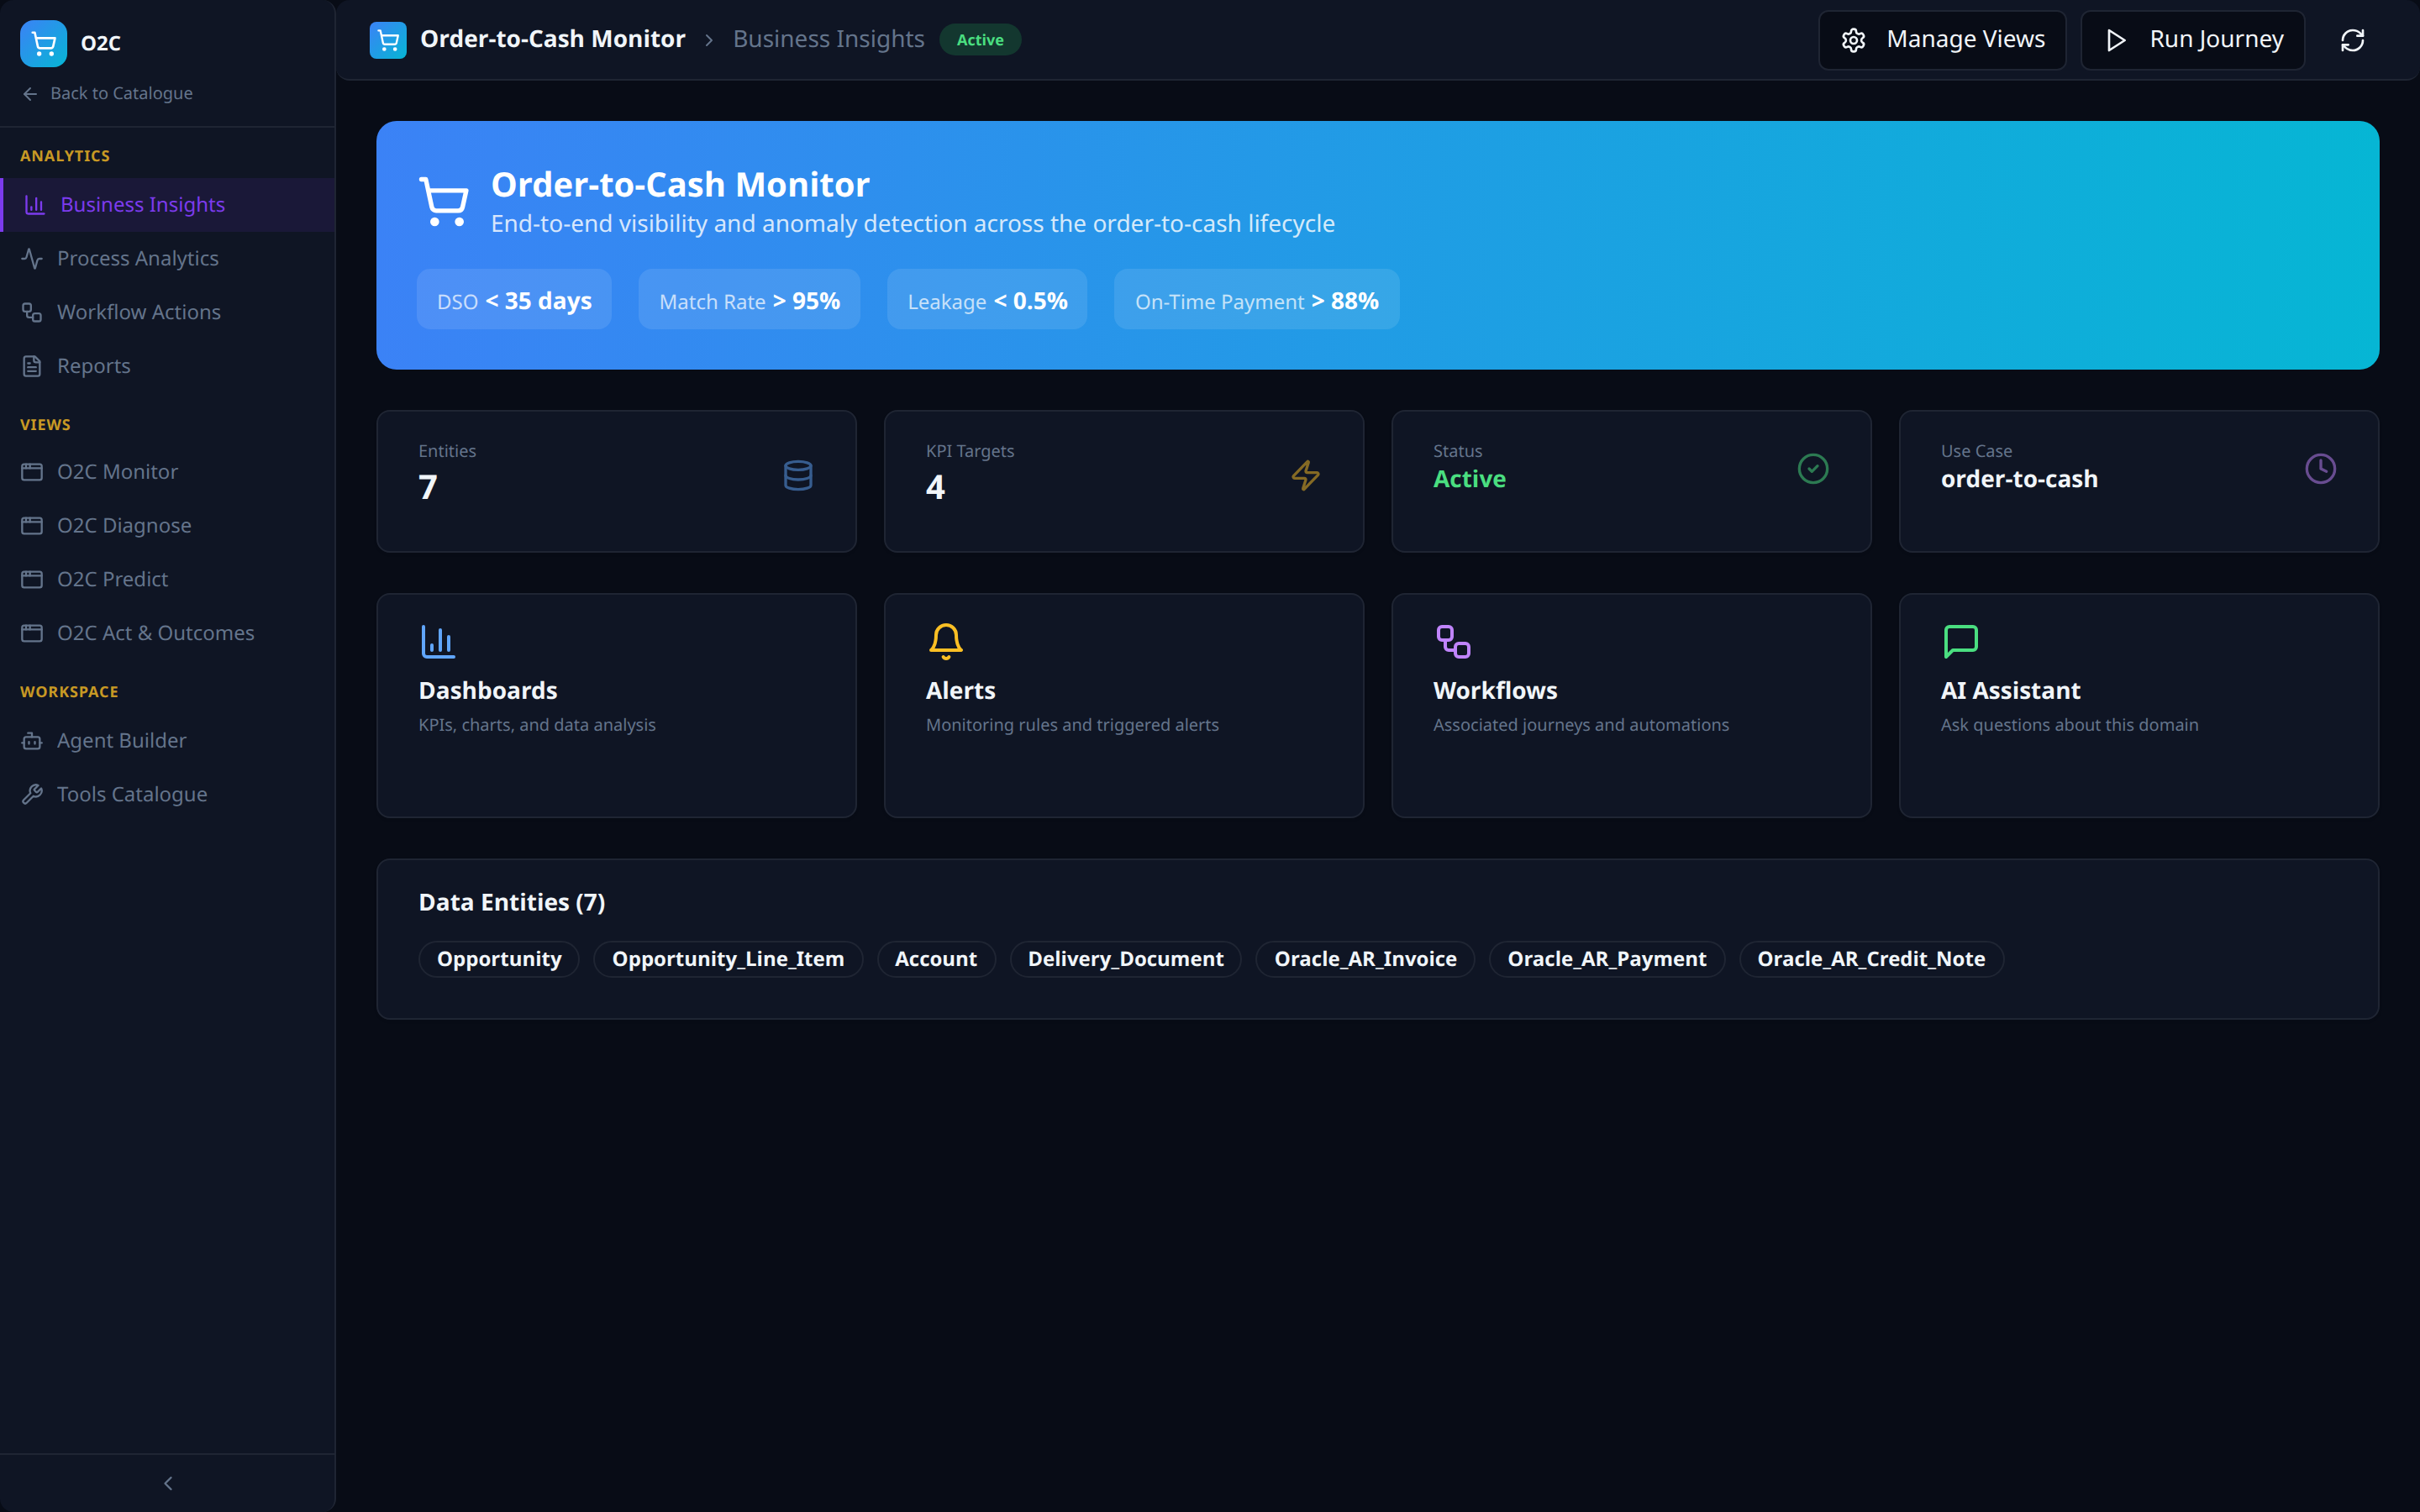
- Hero KPI strip showing the use-case targets (DSO, Match Rate, Leakage, On-Time Payment).
- Stat tiles (Entities, KPI Targets, Status, Use Case slug) and capability cards (Dashboards, Alerts, Workflows, AI Assistant) as quick entry-points.
- Data Entities strip listing every ontology object the Solution consumes.
Analytics -- Process Analytics

- KPI tiles with actual values, deltas, and target thresholds (e.g. Days Sales Outstanding 112.6 days vs target < 35 days).
- Composition charts (Order Match Status donut, Top Anomaly Scores bar) plus a Top Risk Orders drill-down table.
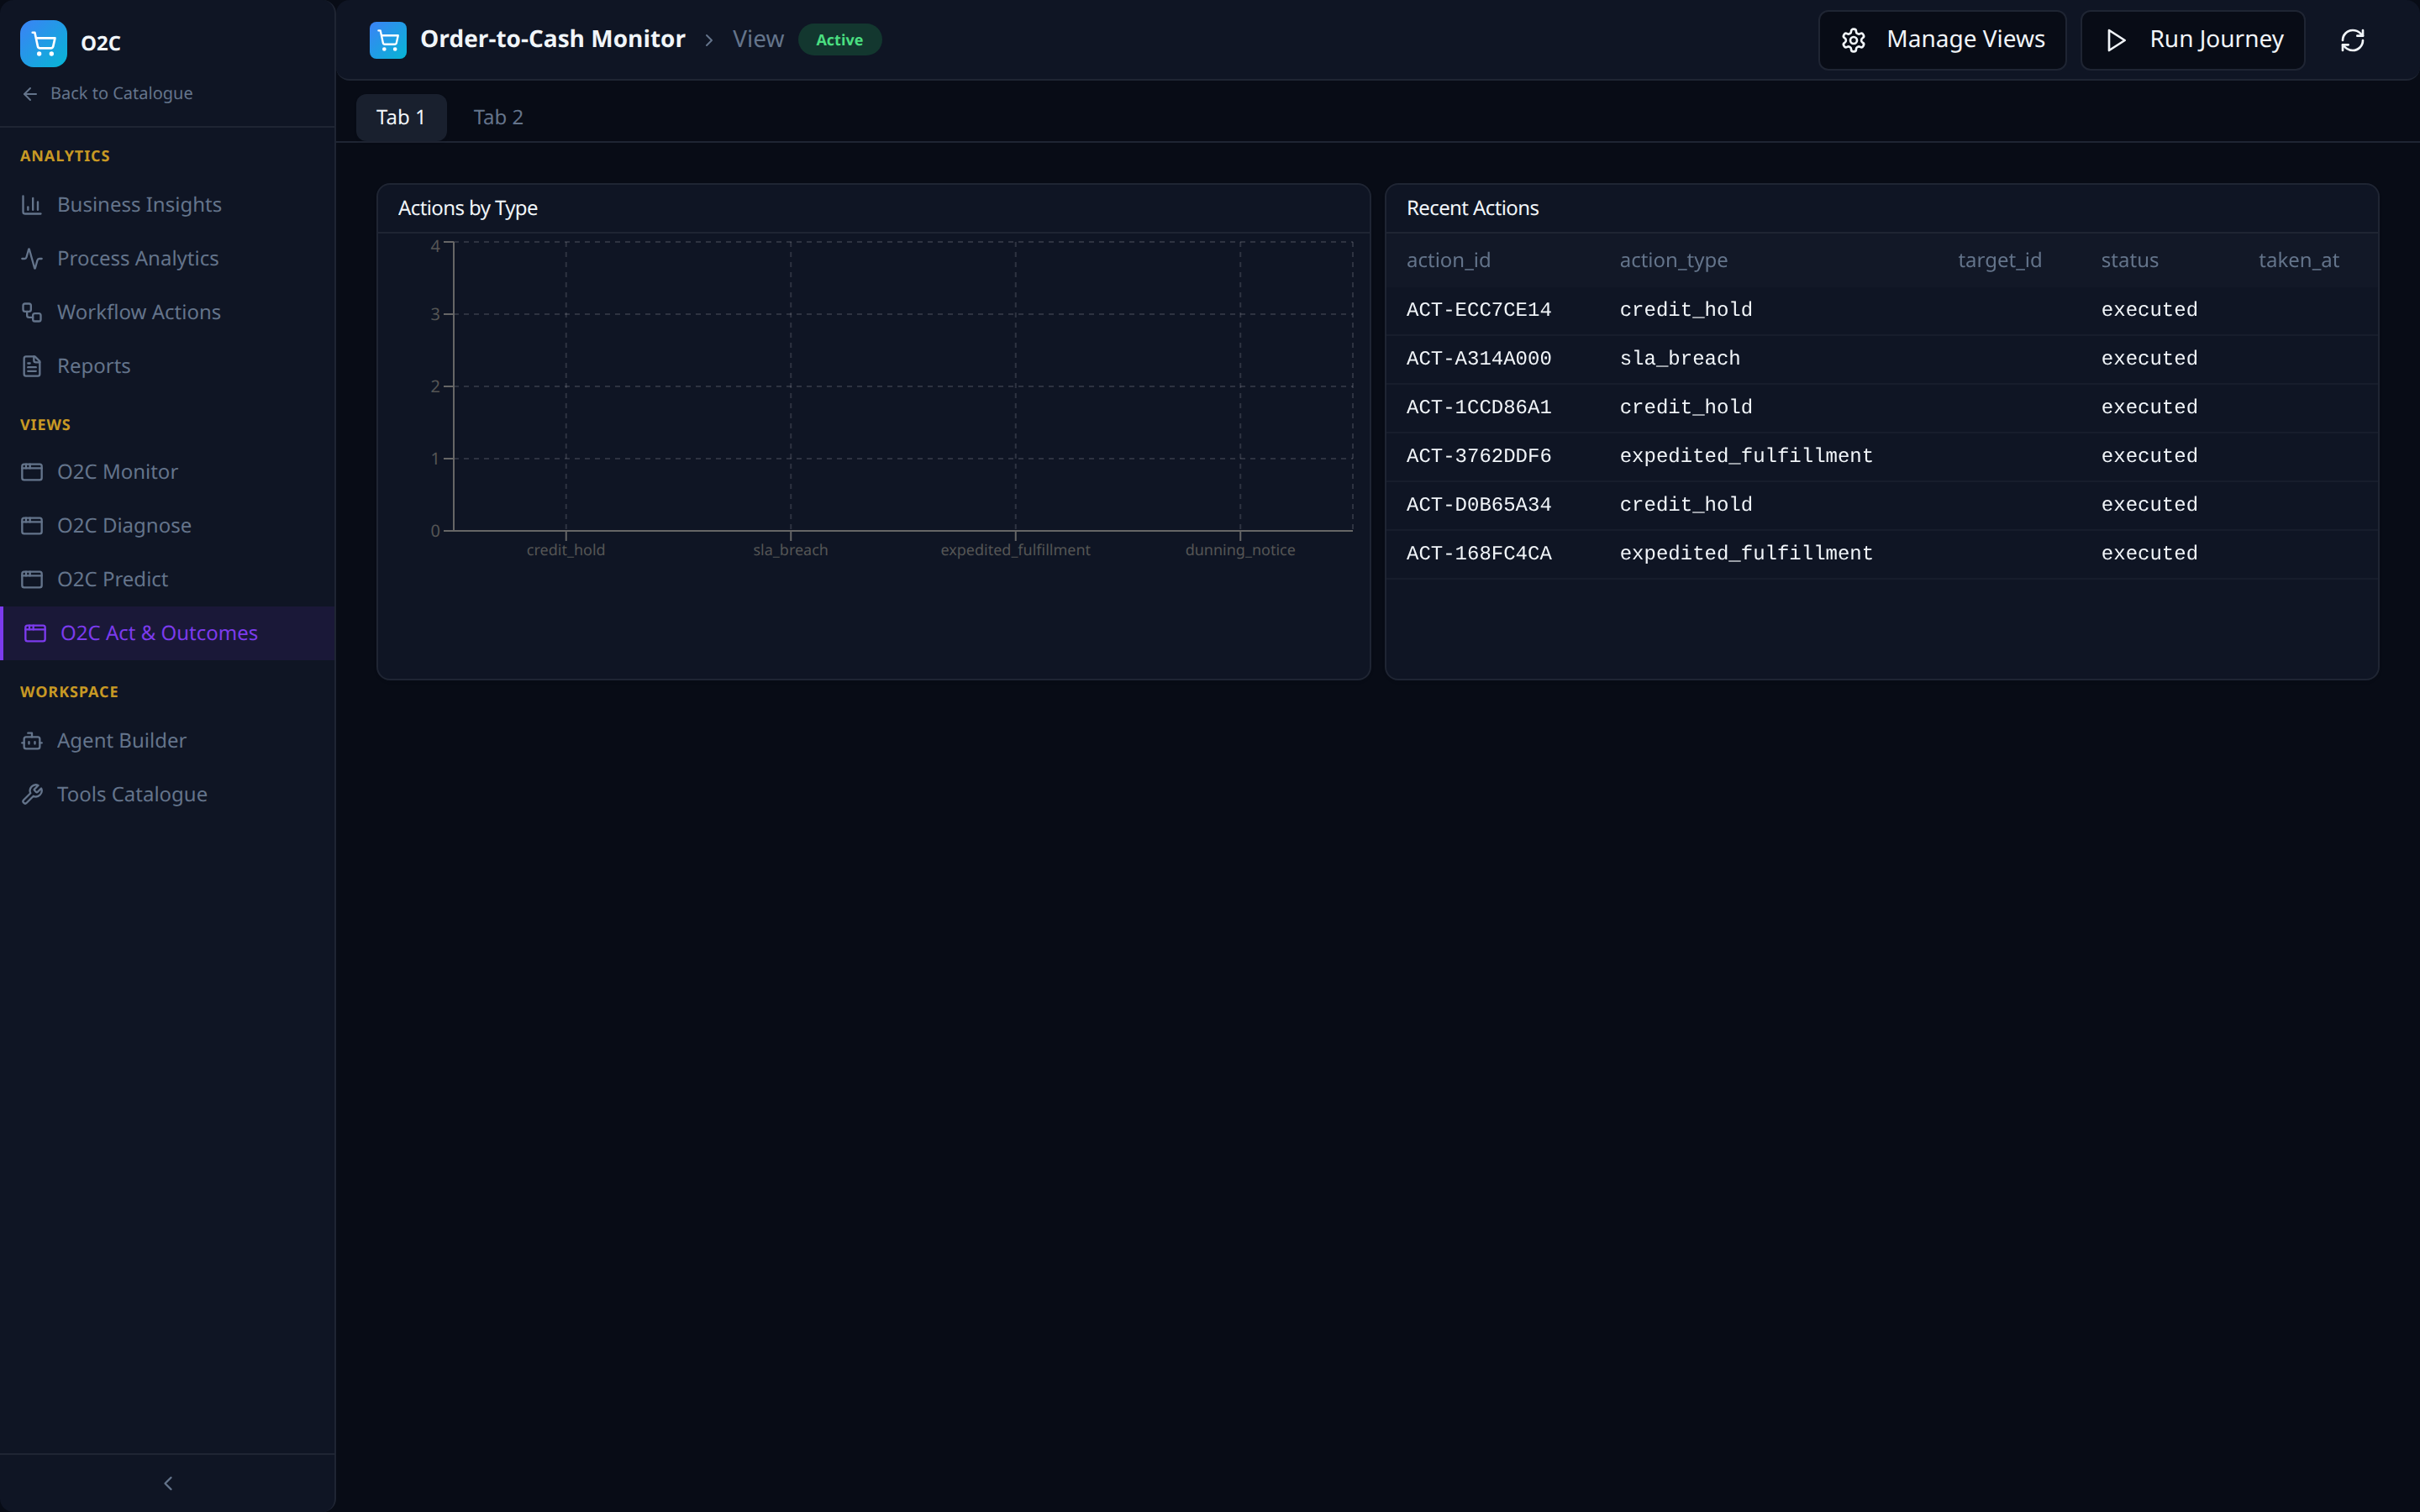
Analytics -- Workflow Actions
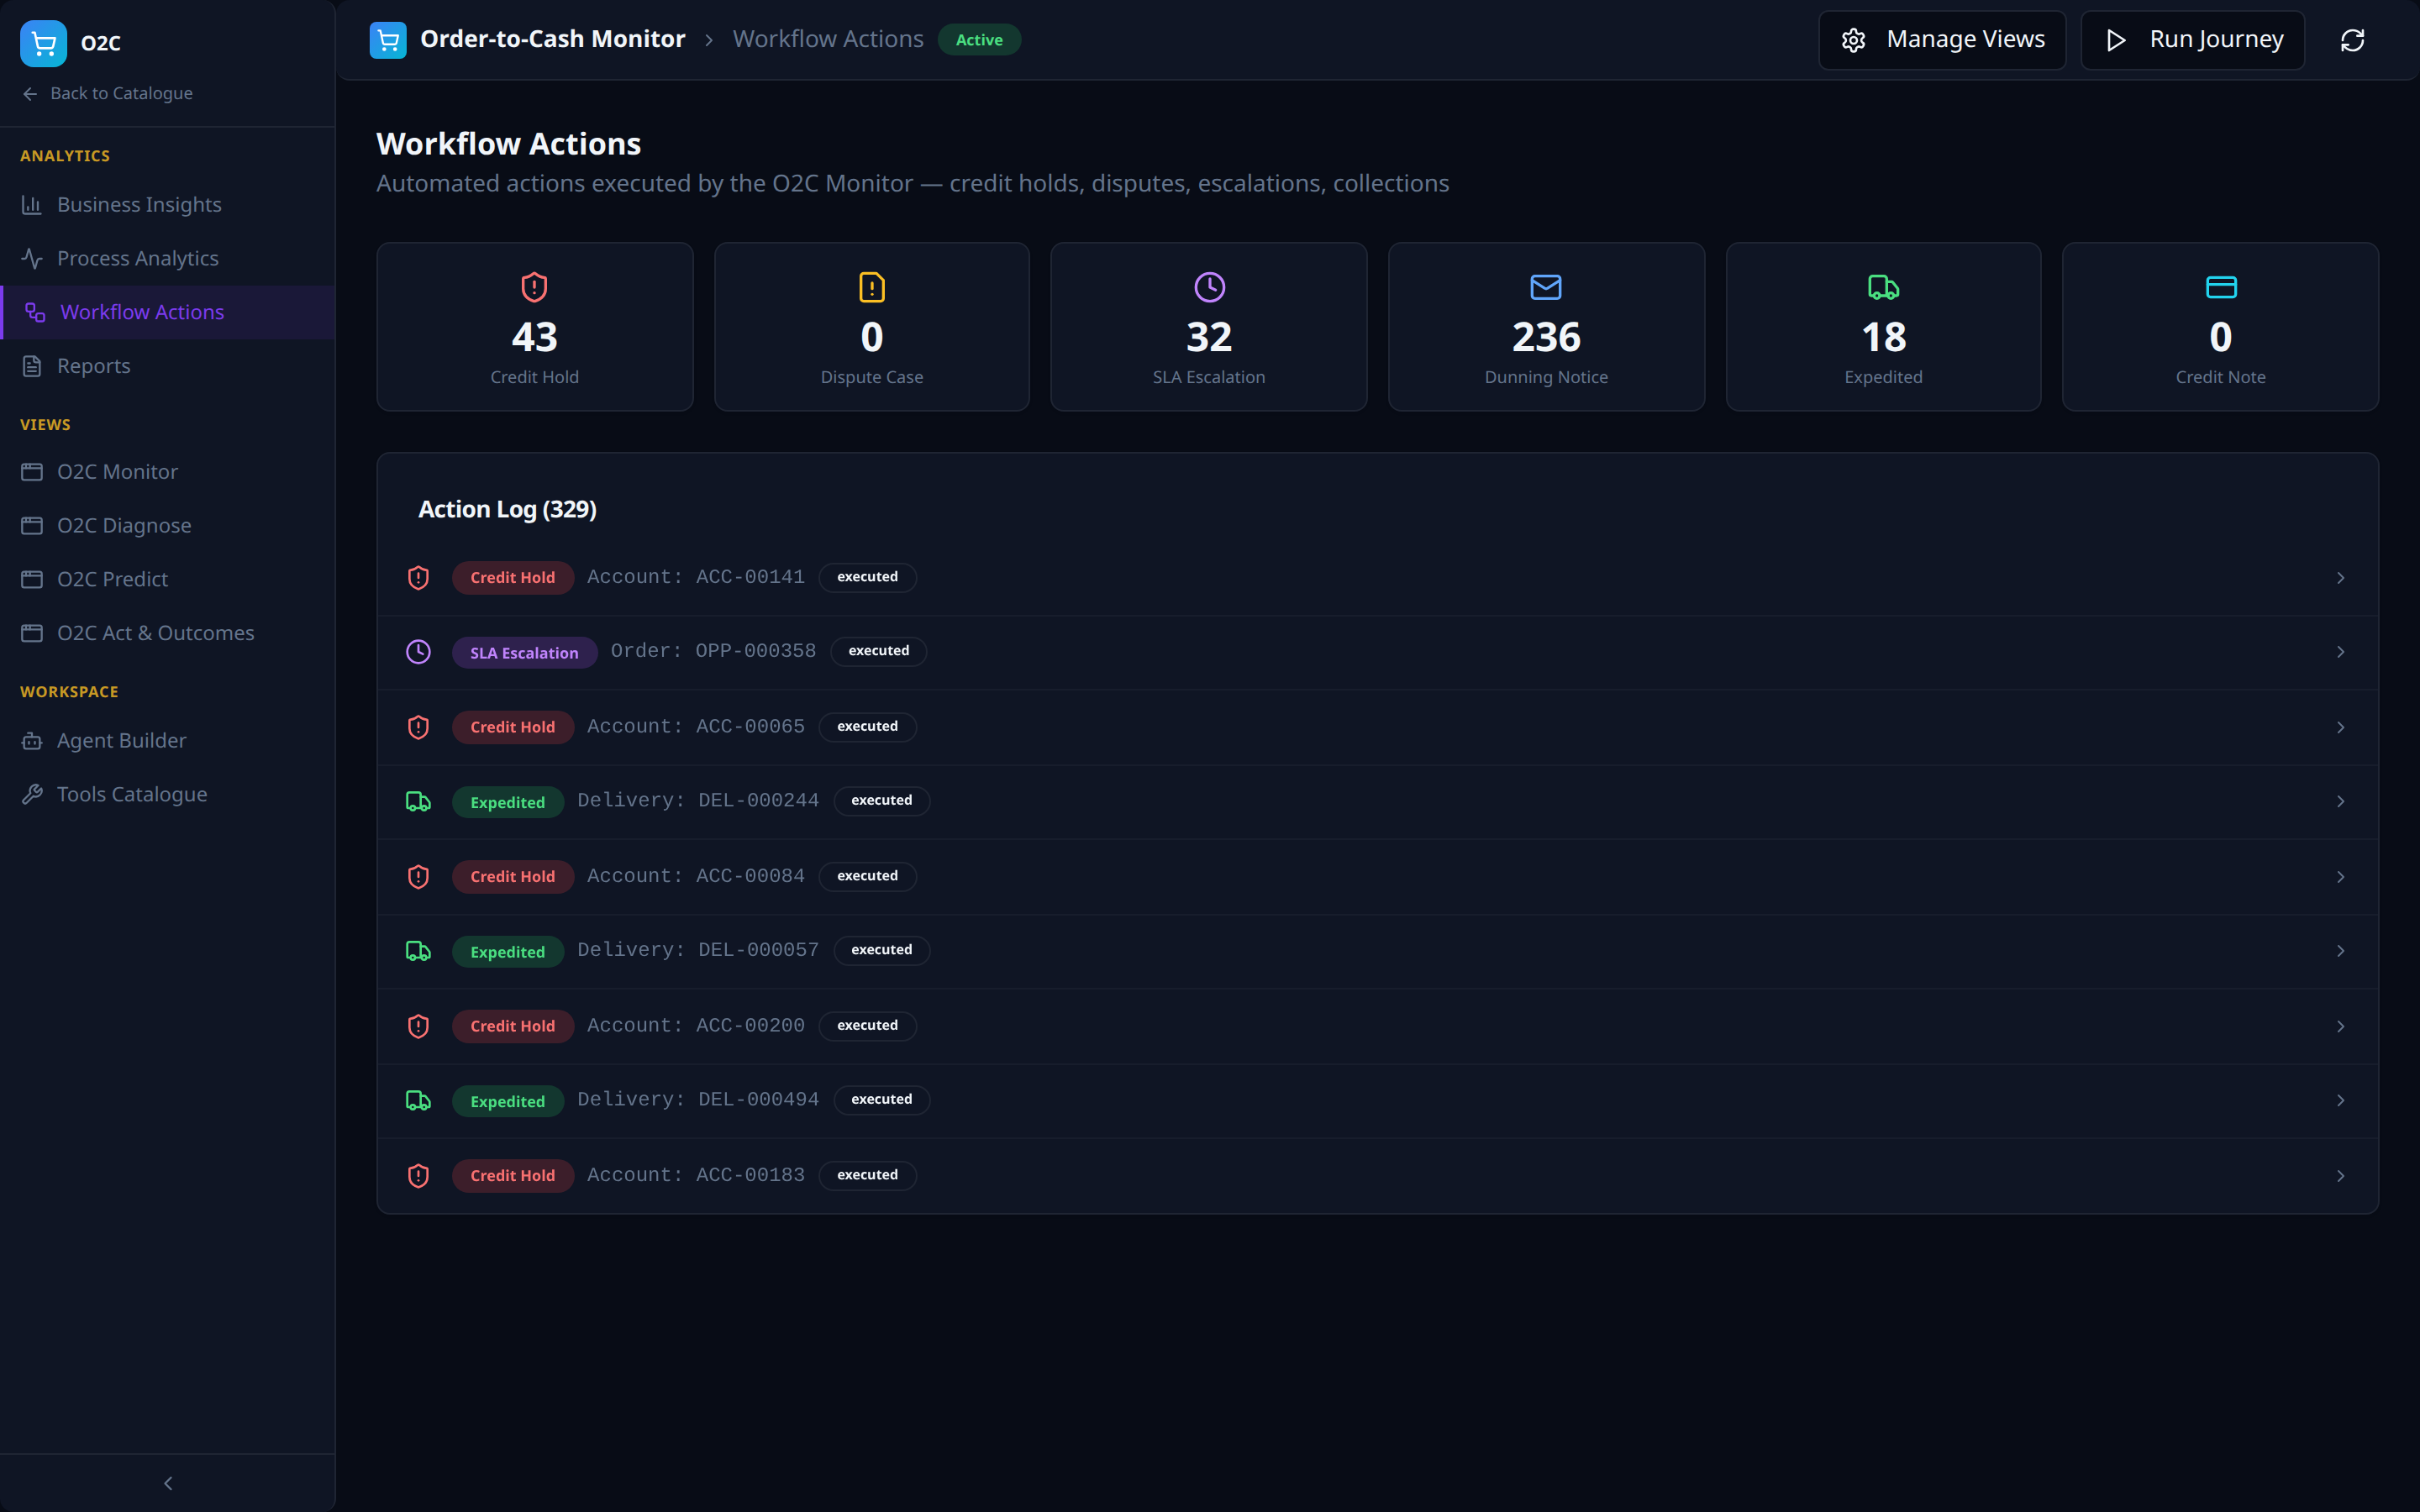
- Per-action-type counters (Credit Hold, Dispute Case, SLA Escalation, Dunning Notice, Expedited, Credit Note).
- Action Log feed of every executed action with type, target entity, and status.
Analytics -- Reports
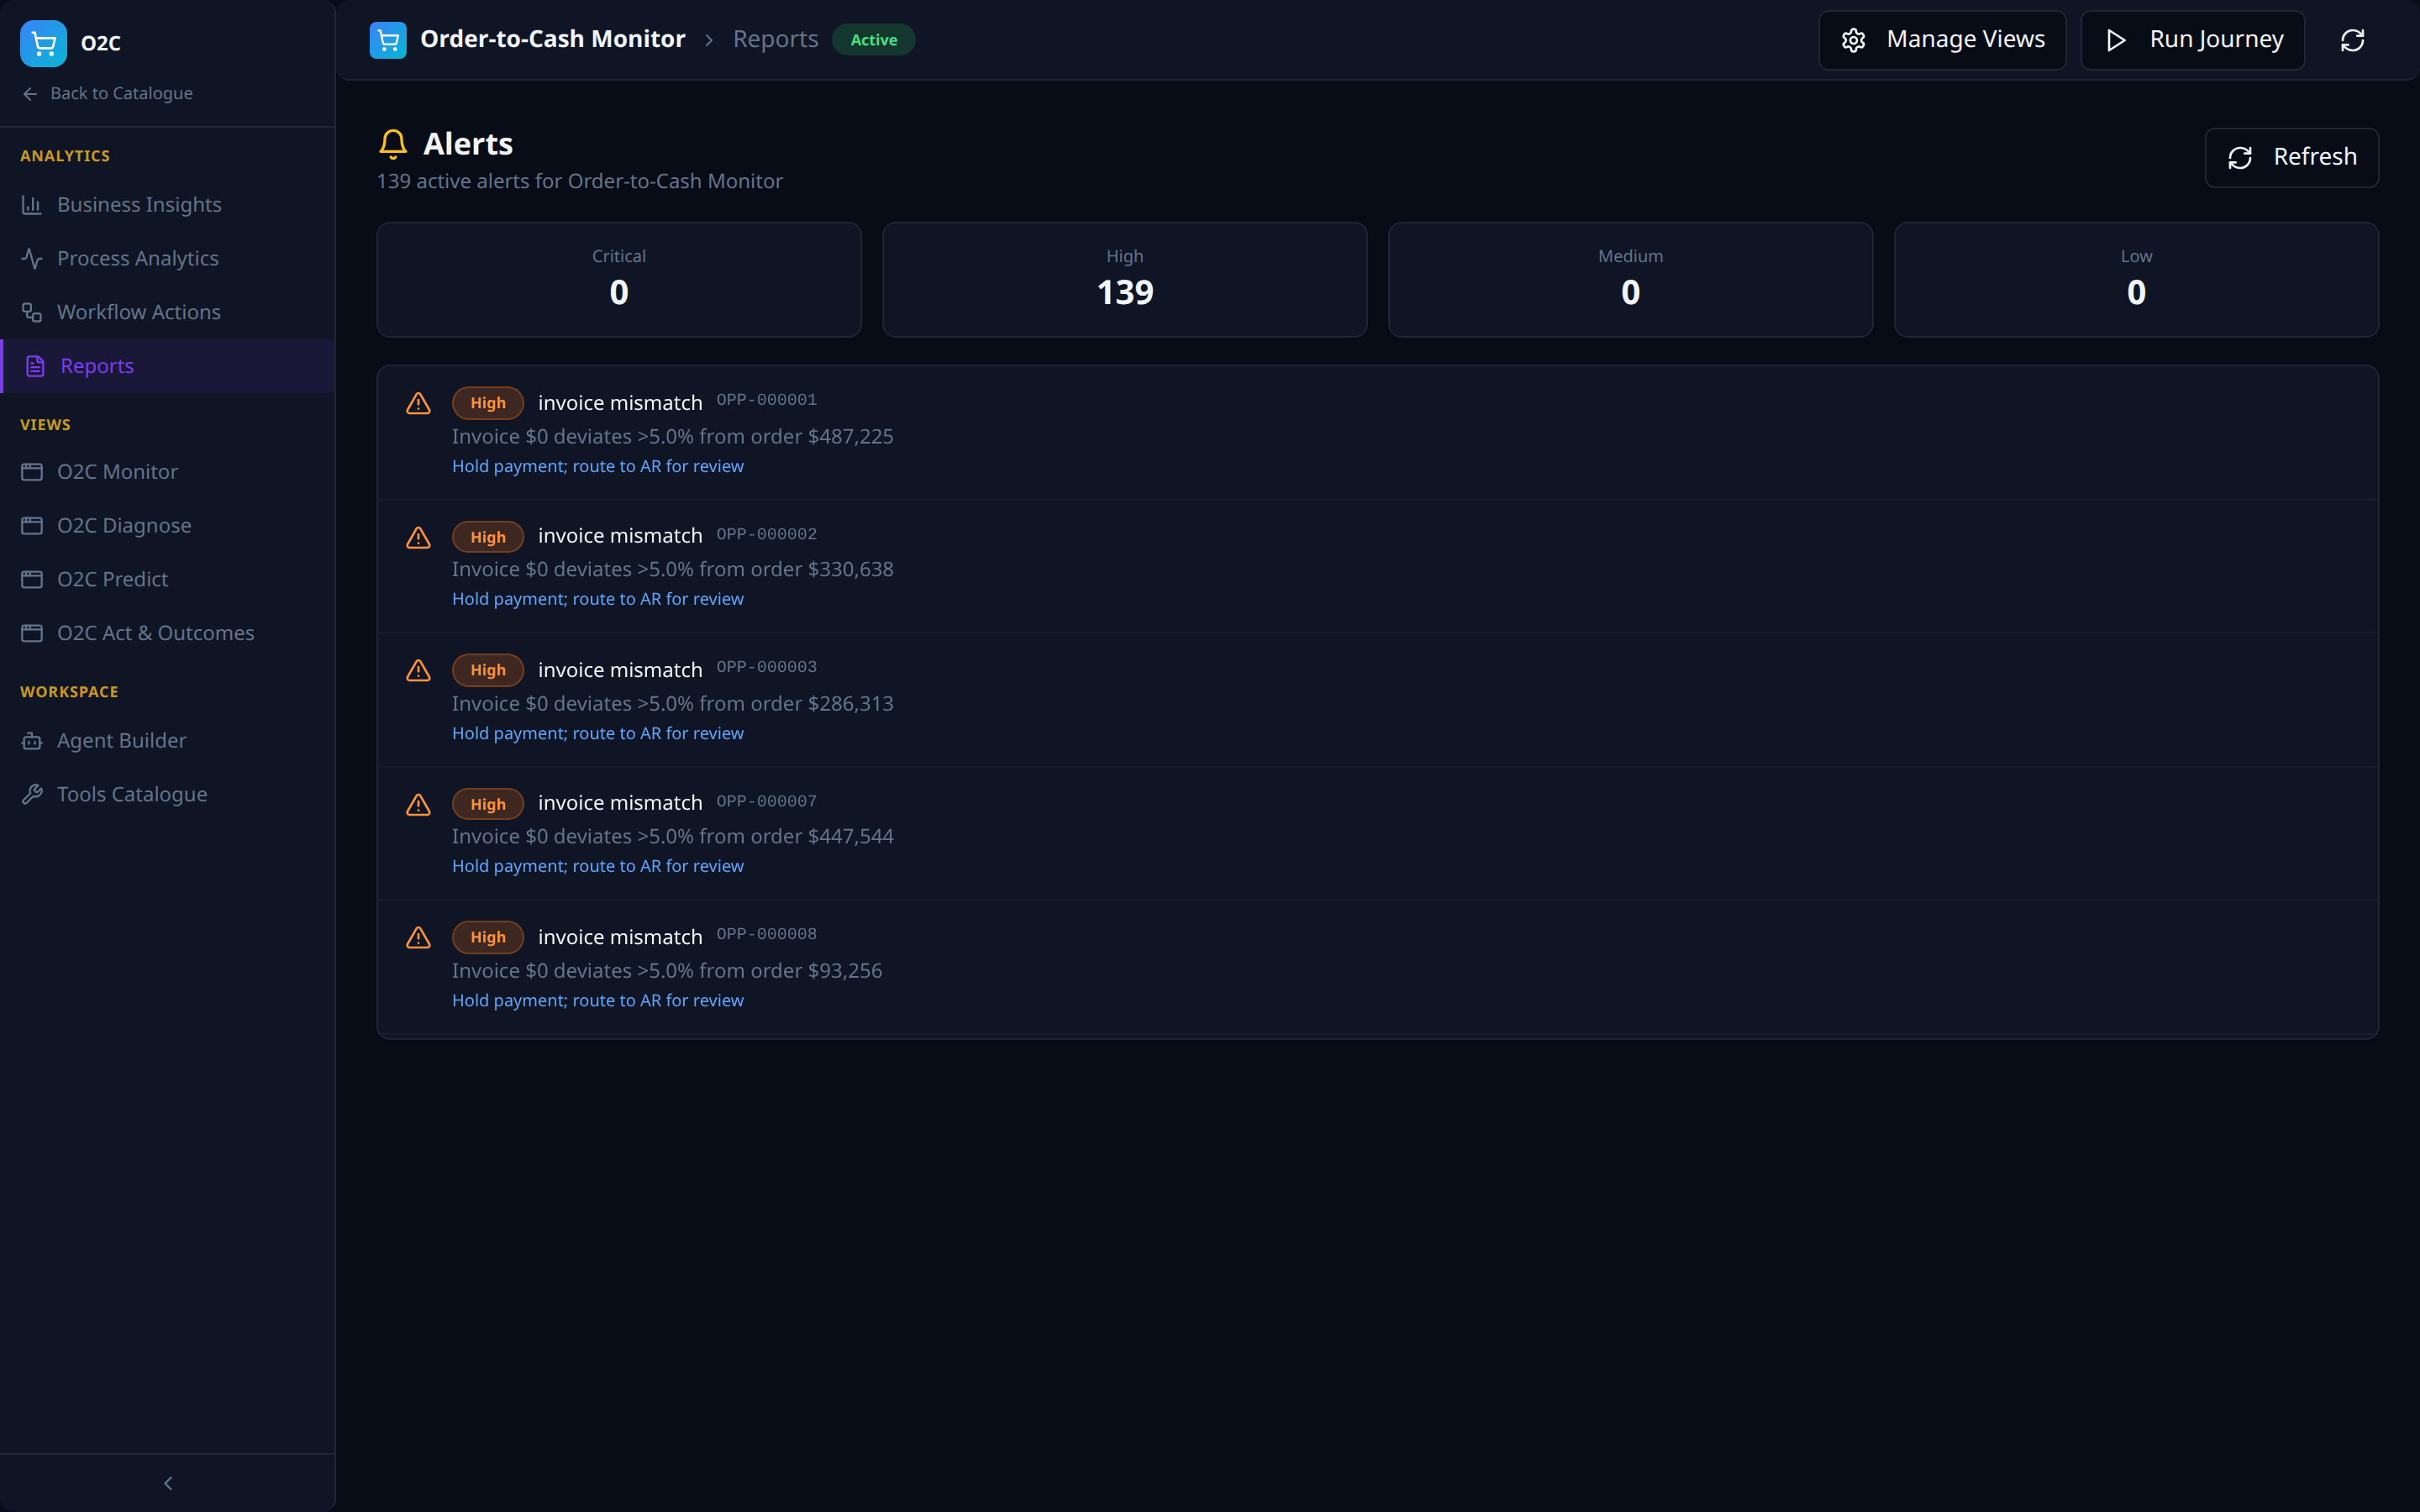
- Severity counters (Critical / High / Medium / Low) and a scrollable alert feed.
- Each alert carries type, target order, deviation summary, and remediation action.
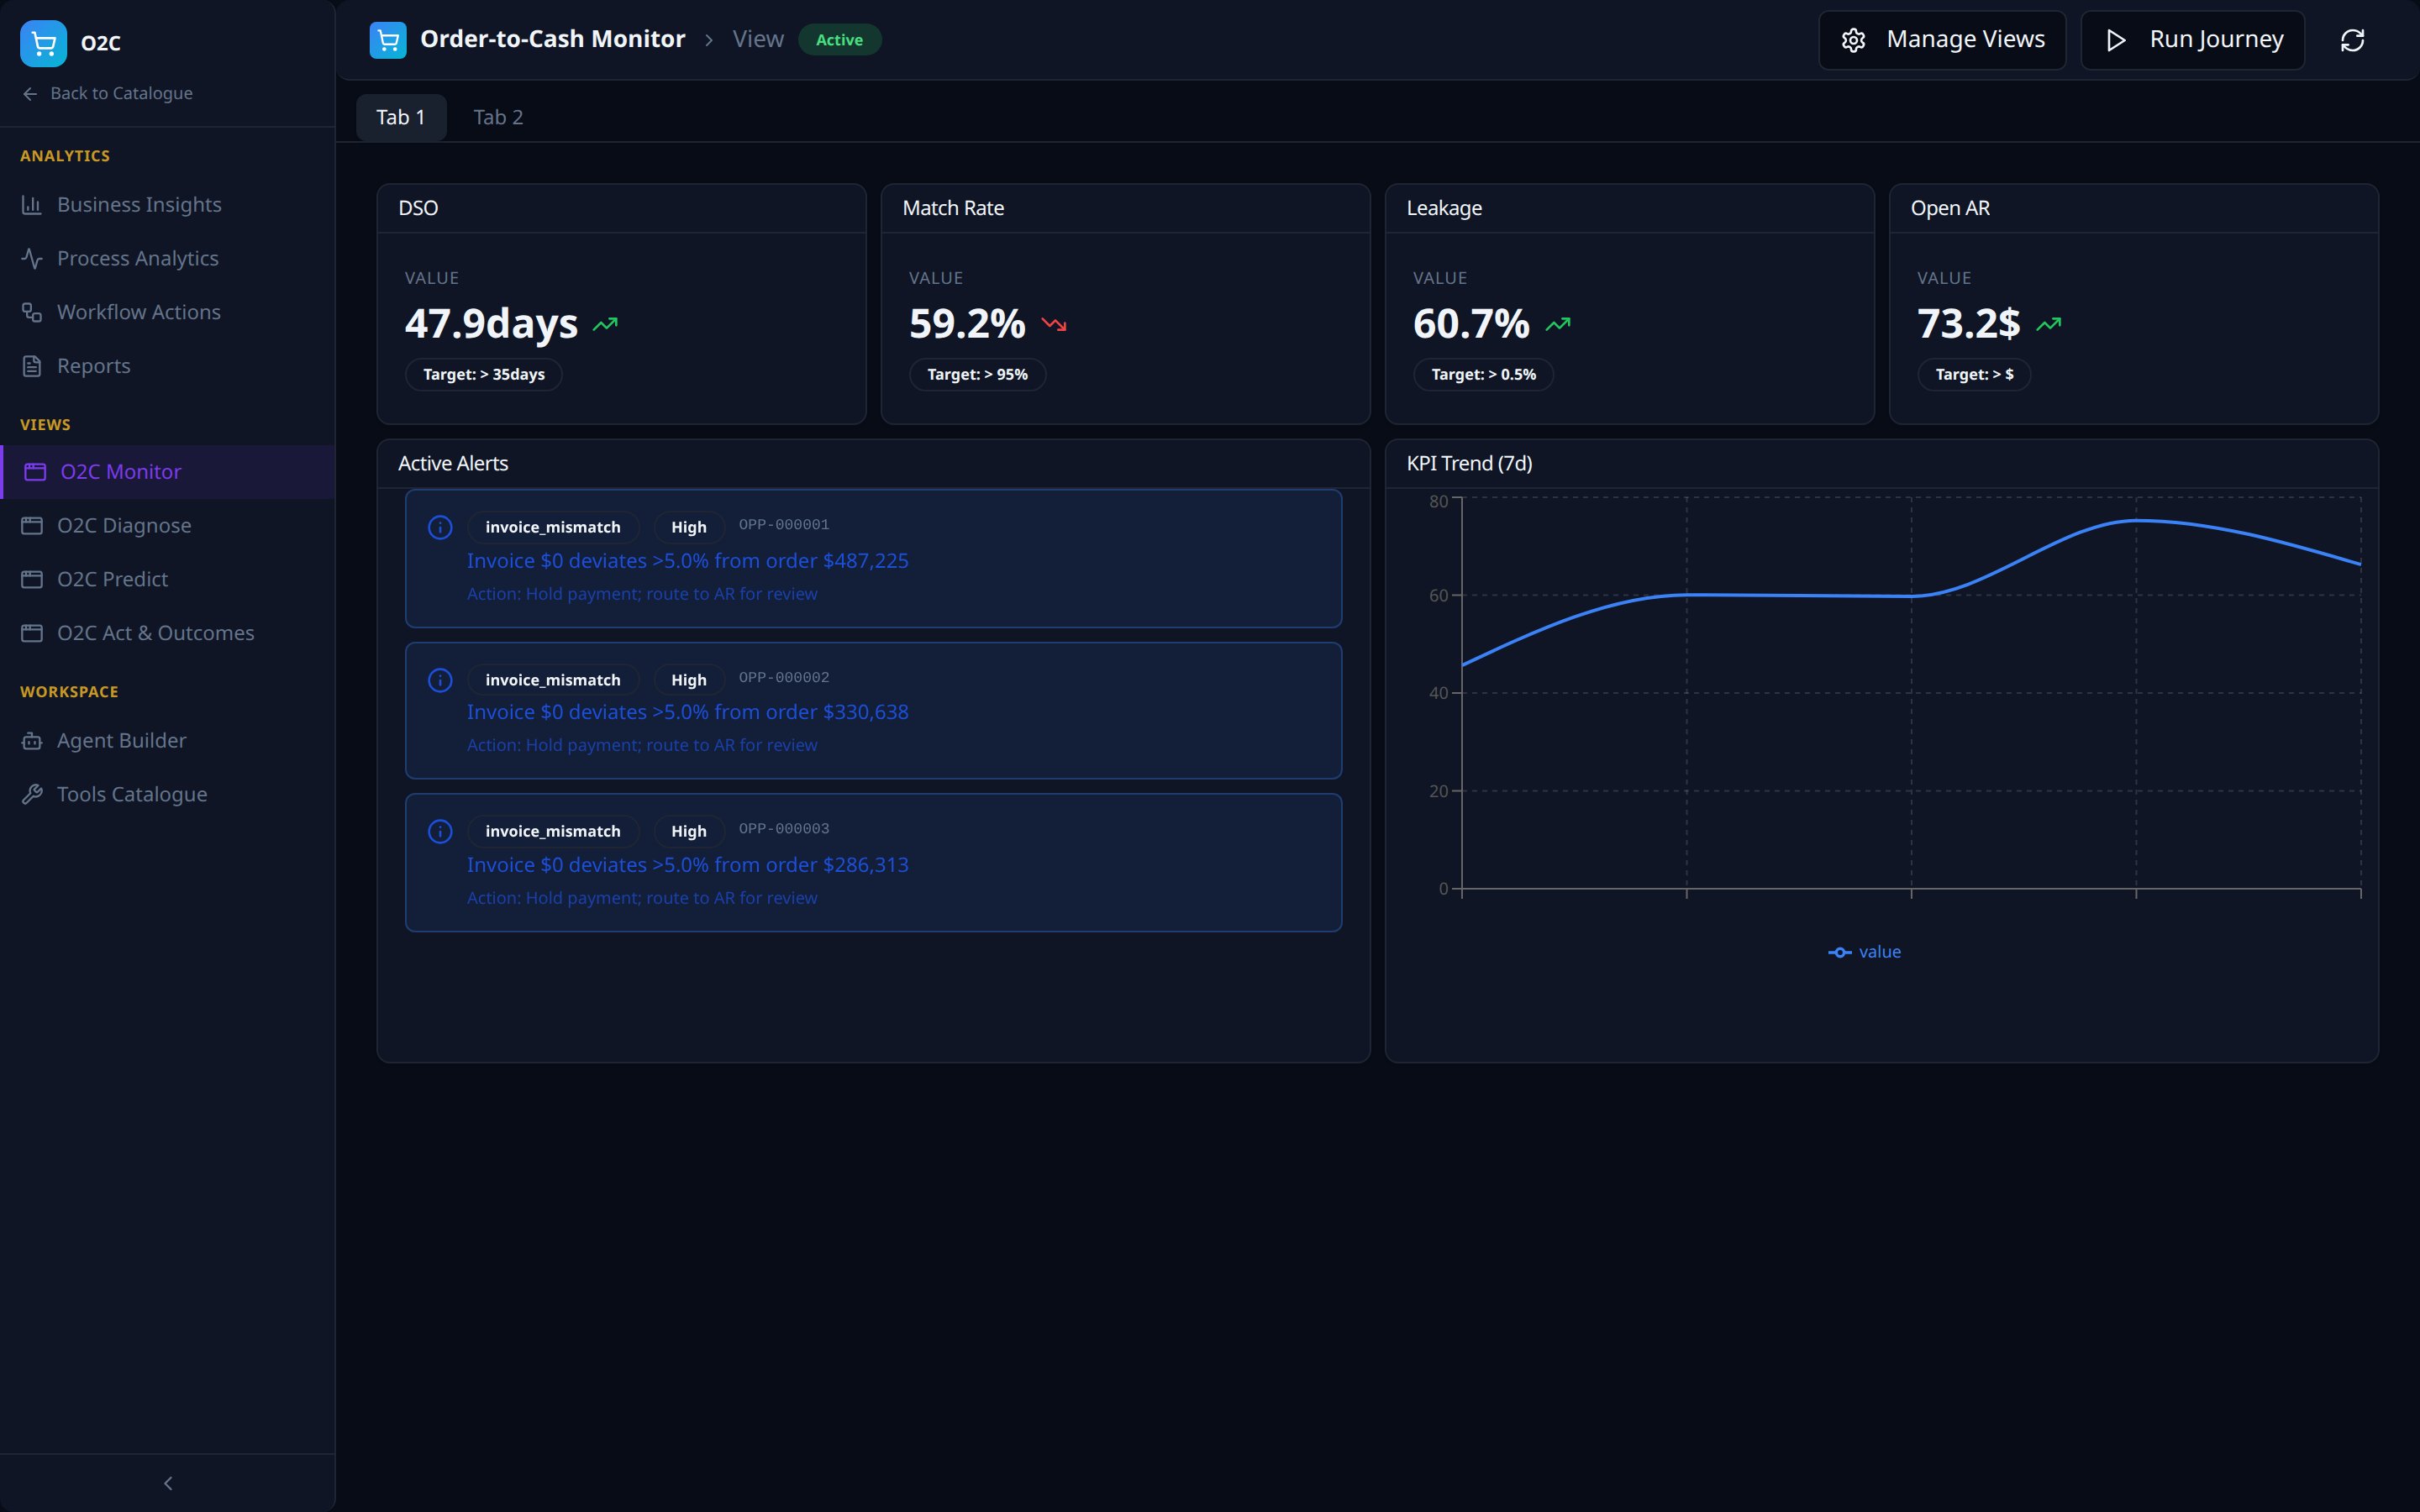
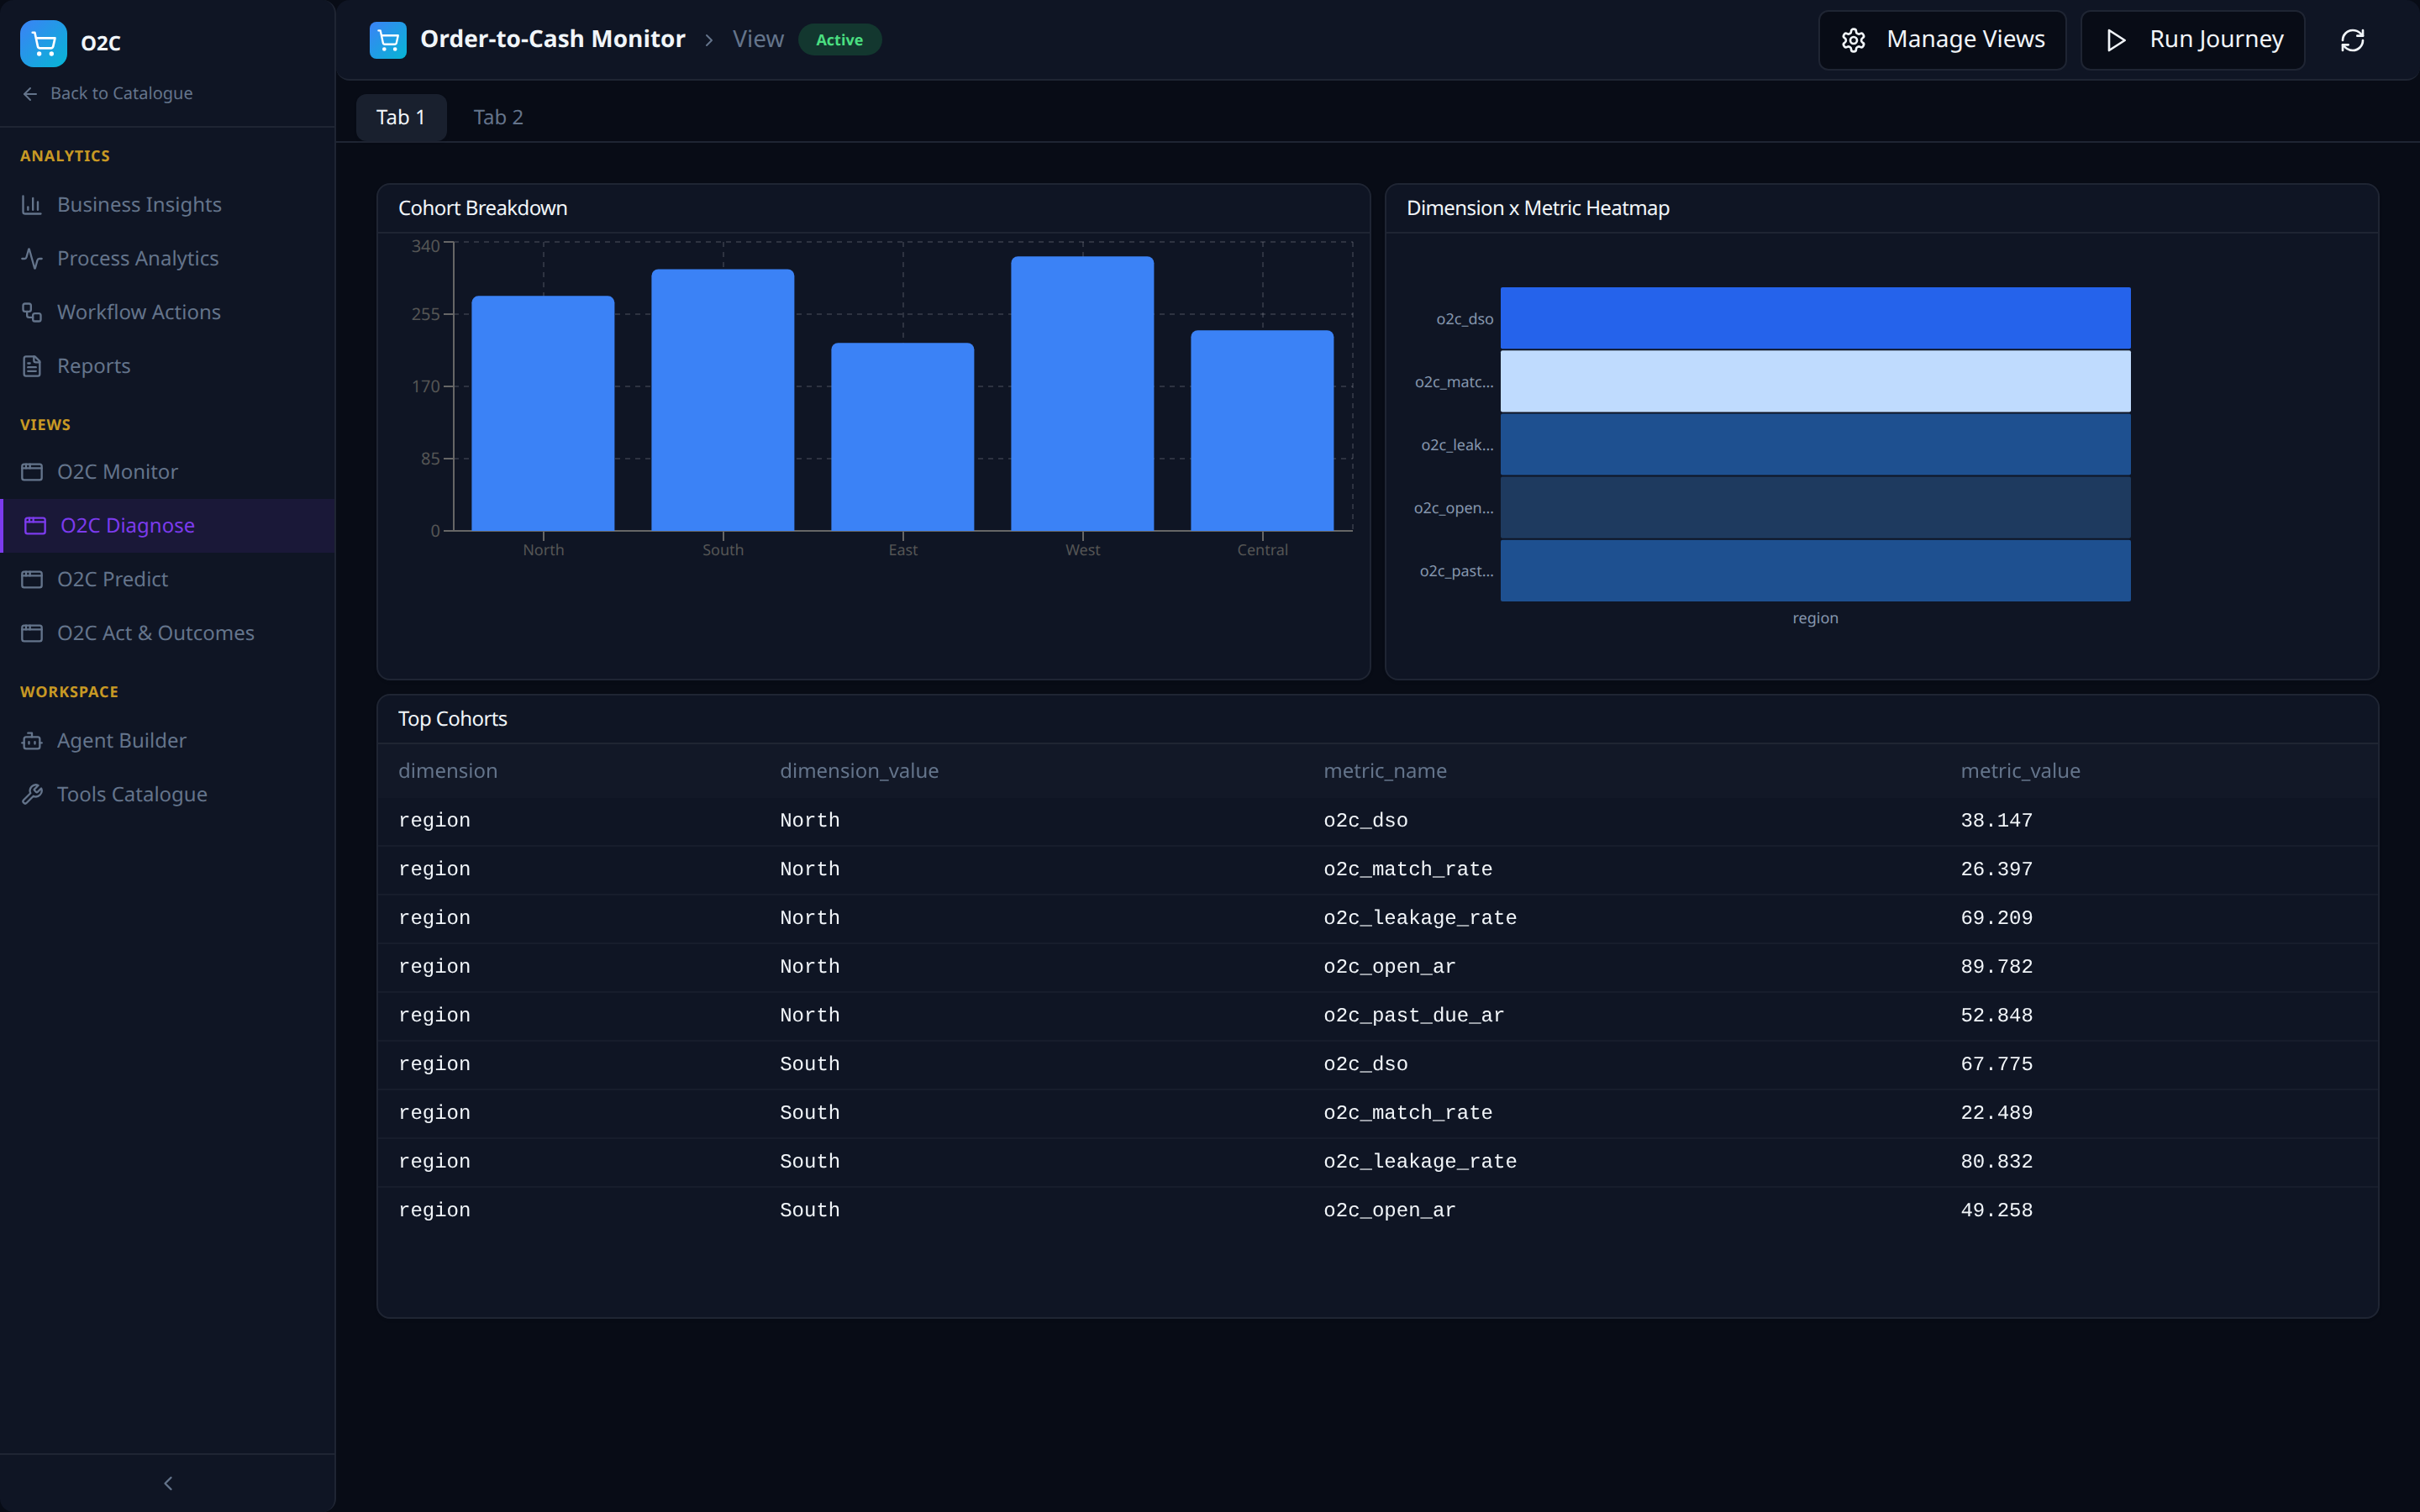
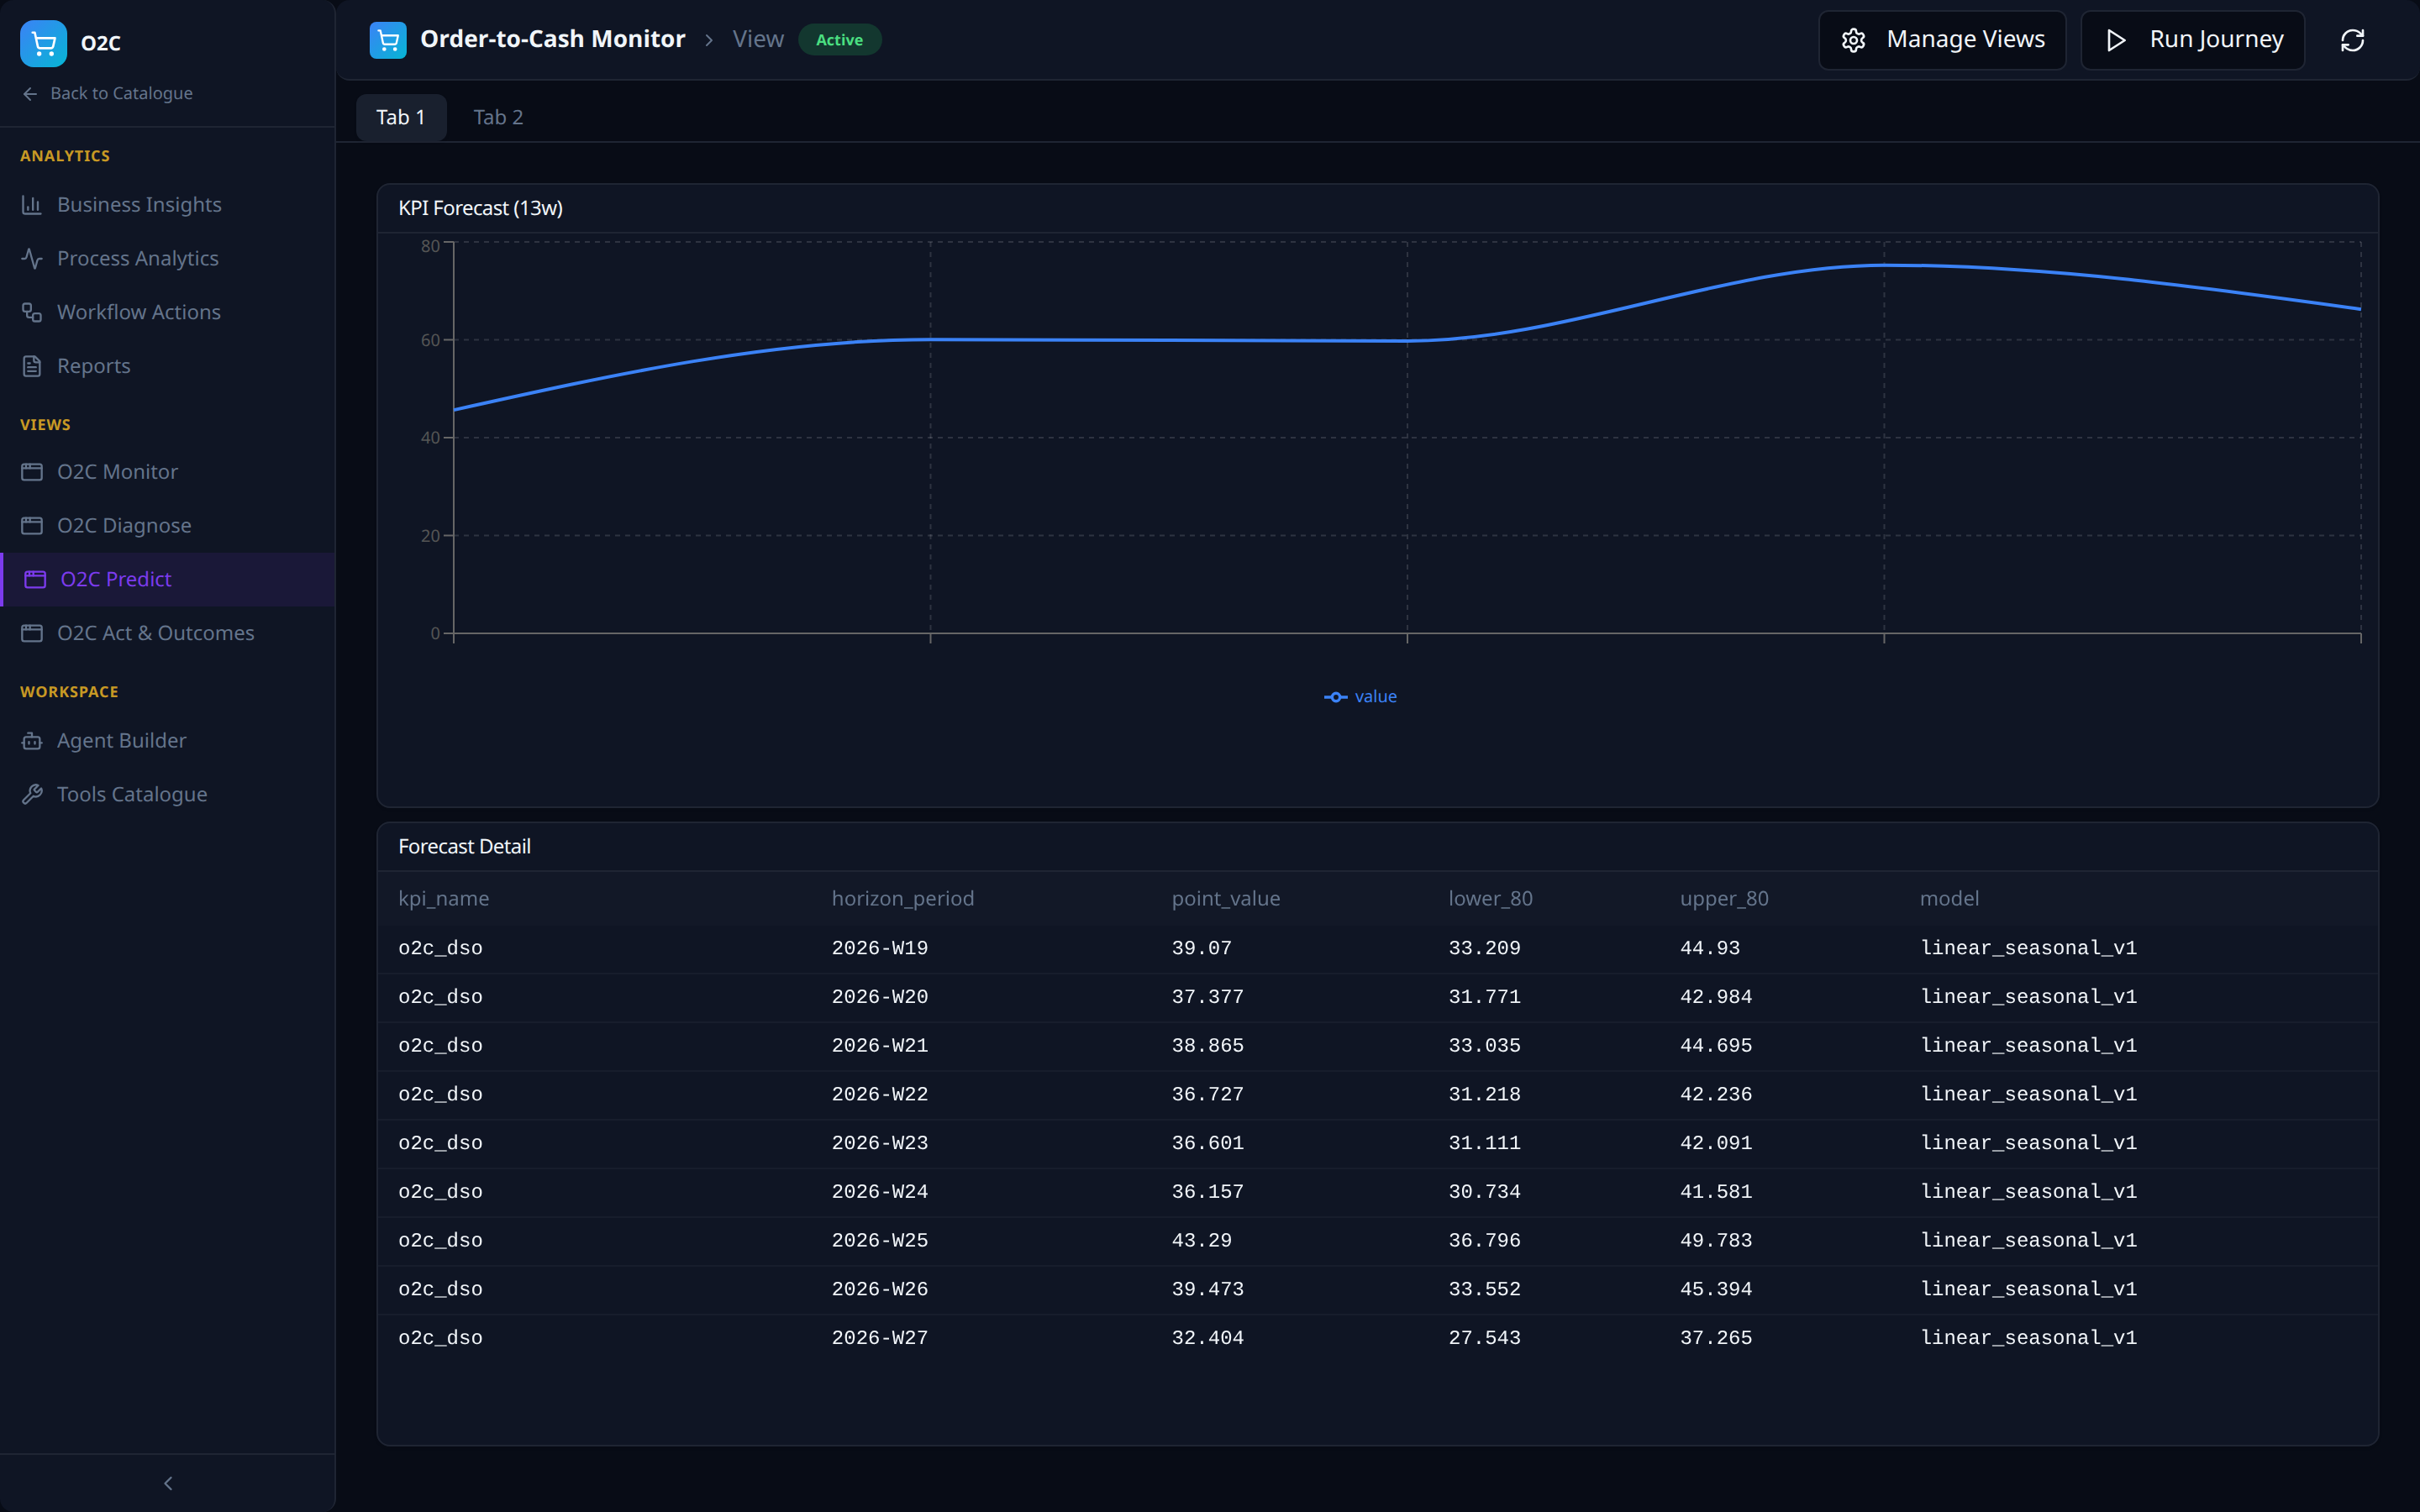
Views -- the four-views framework, instantiated
The four auto-seeded Views (outcomes / predict / diagnose / monitor from AI Analytics) appear as left-nav items: O2C Monitor, O2C Diagnose, O2C Predict, O2C Act & Outcomes. Each is a multi-tab dashboard composed of intent-specific panels against the same VDL.
Workspace -- Agent Builder
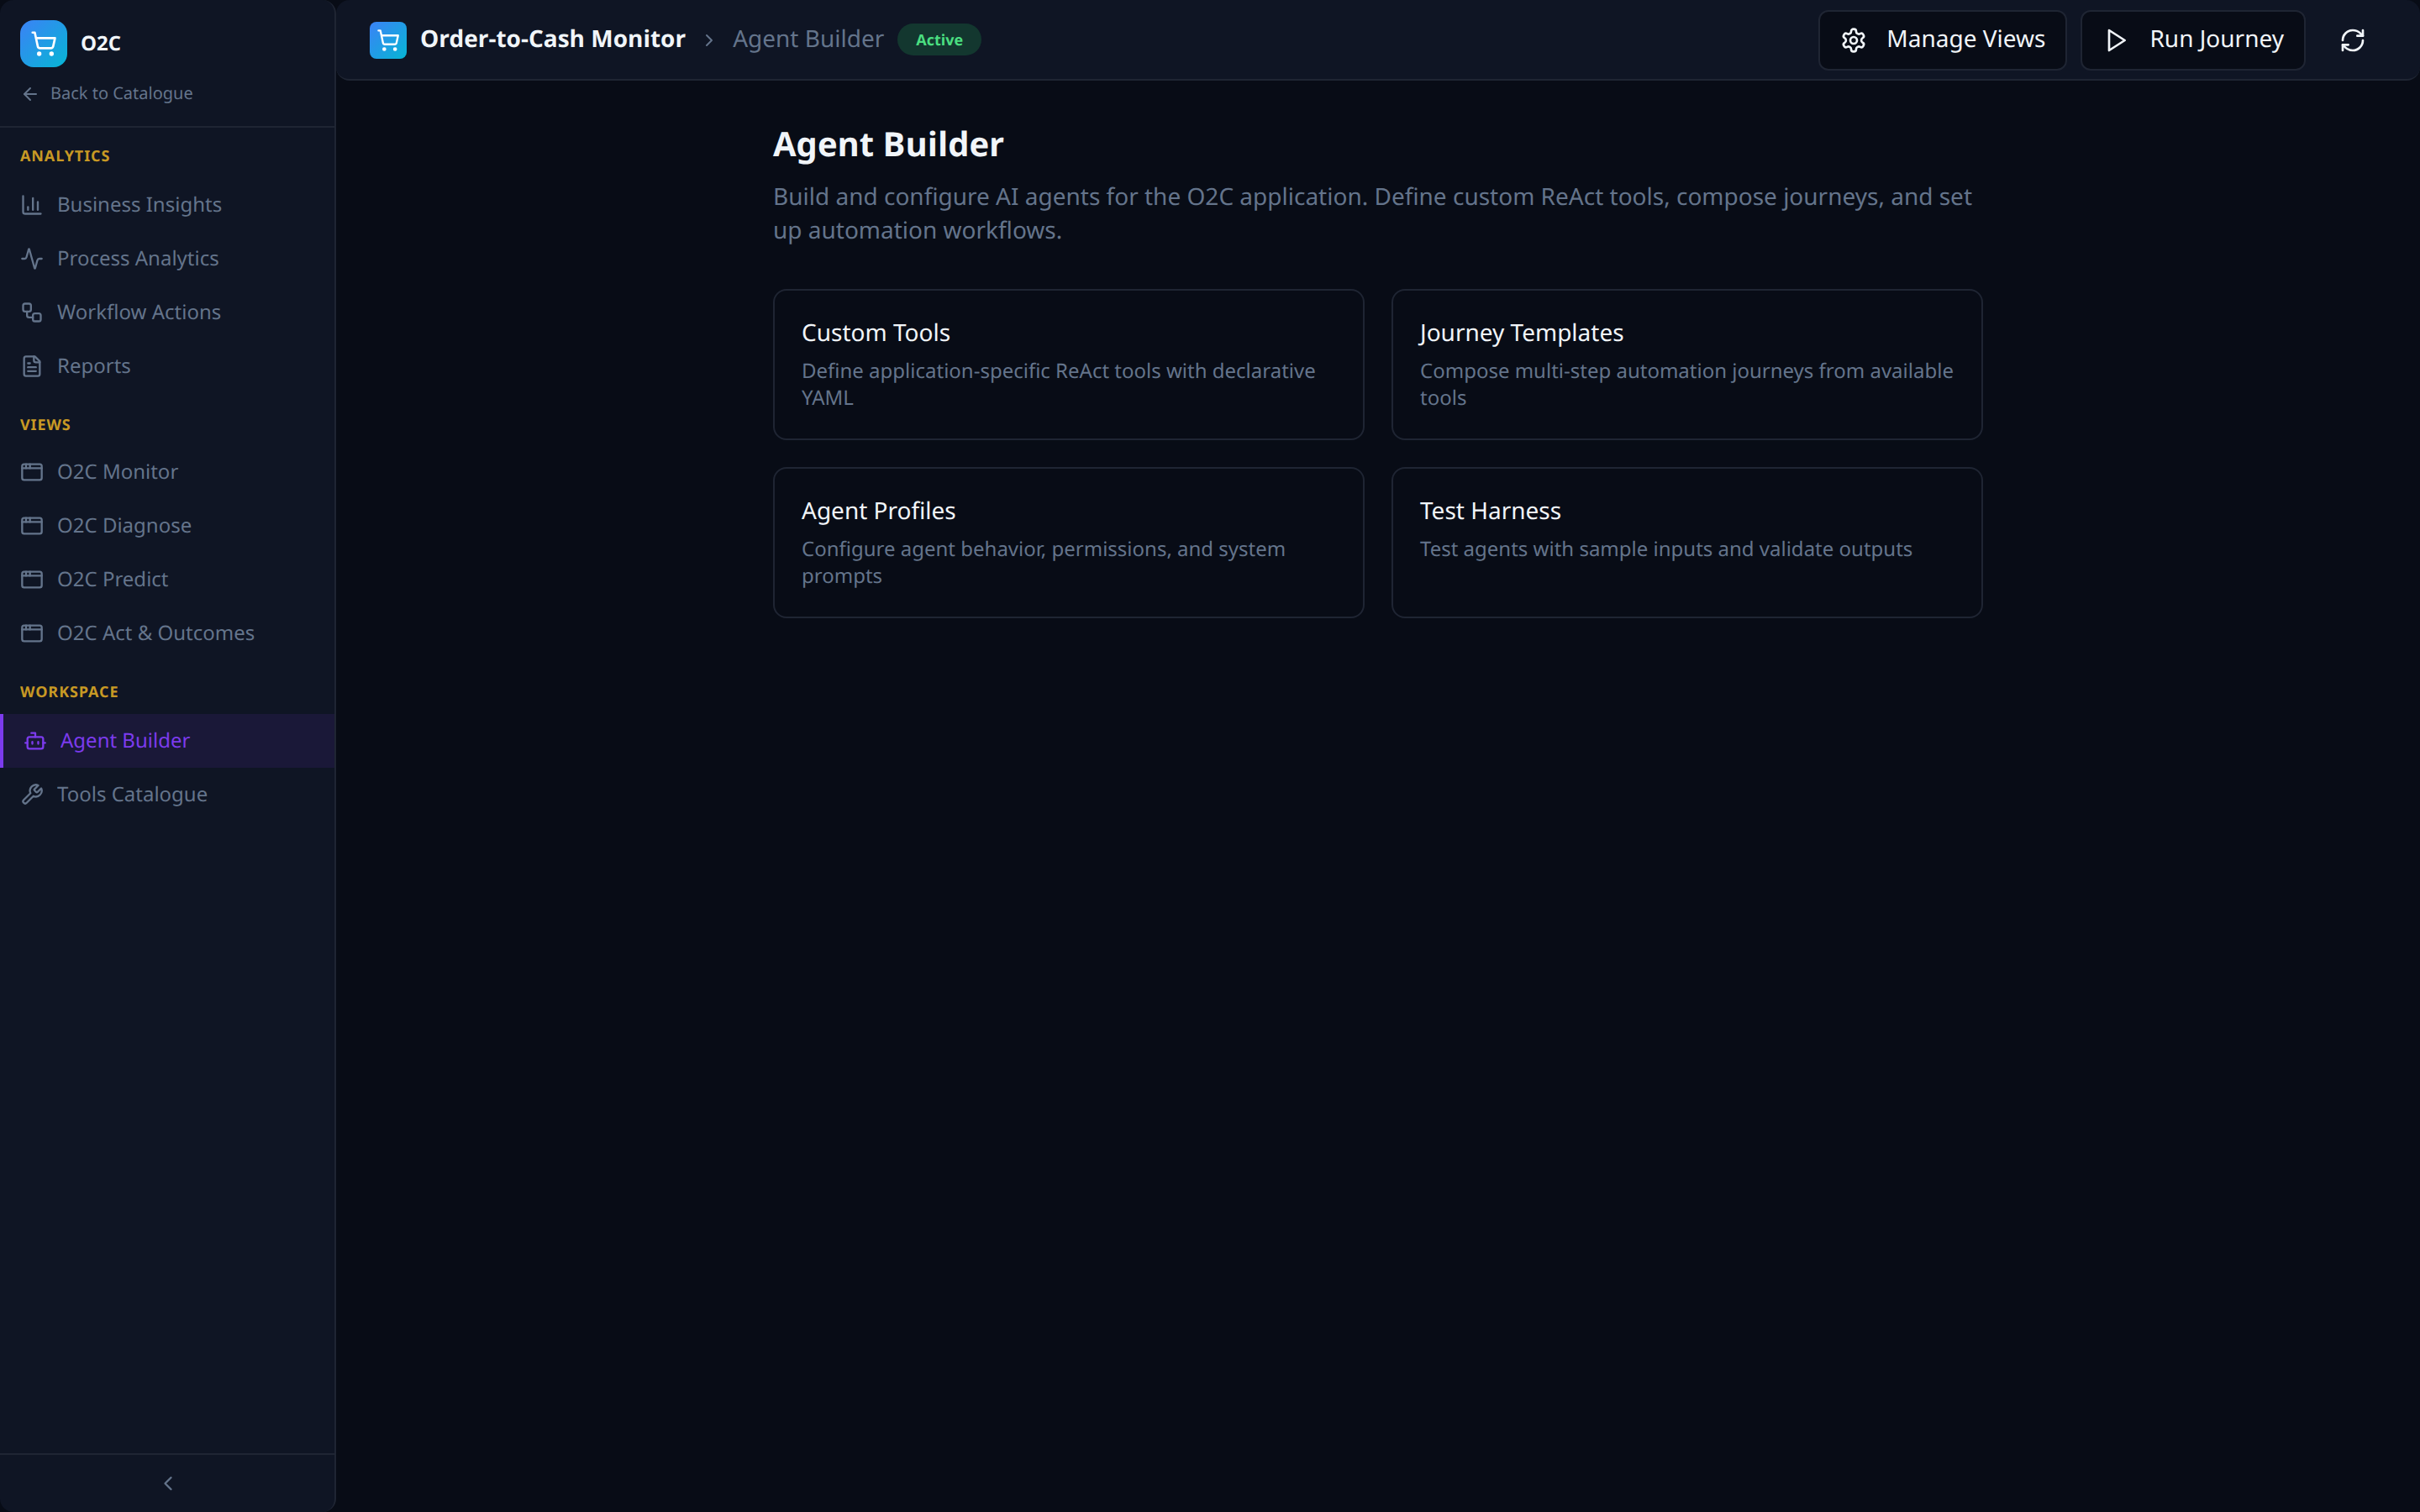
- Custom Tools (declare ReAct tools as YAML), Journey Templates (compose automations), Agent Profiles (behaviour, permissions, system prompts), Test Harness (sample-input validation).
Workspace -- Tools Catalogue
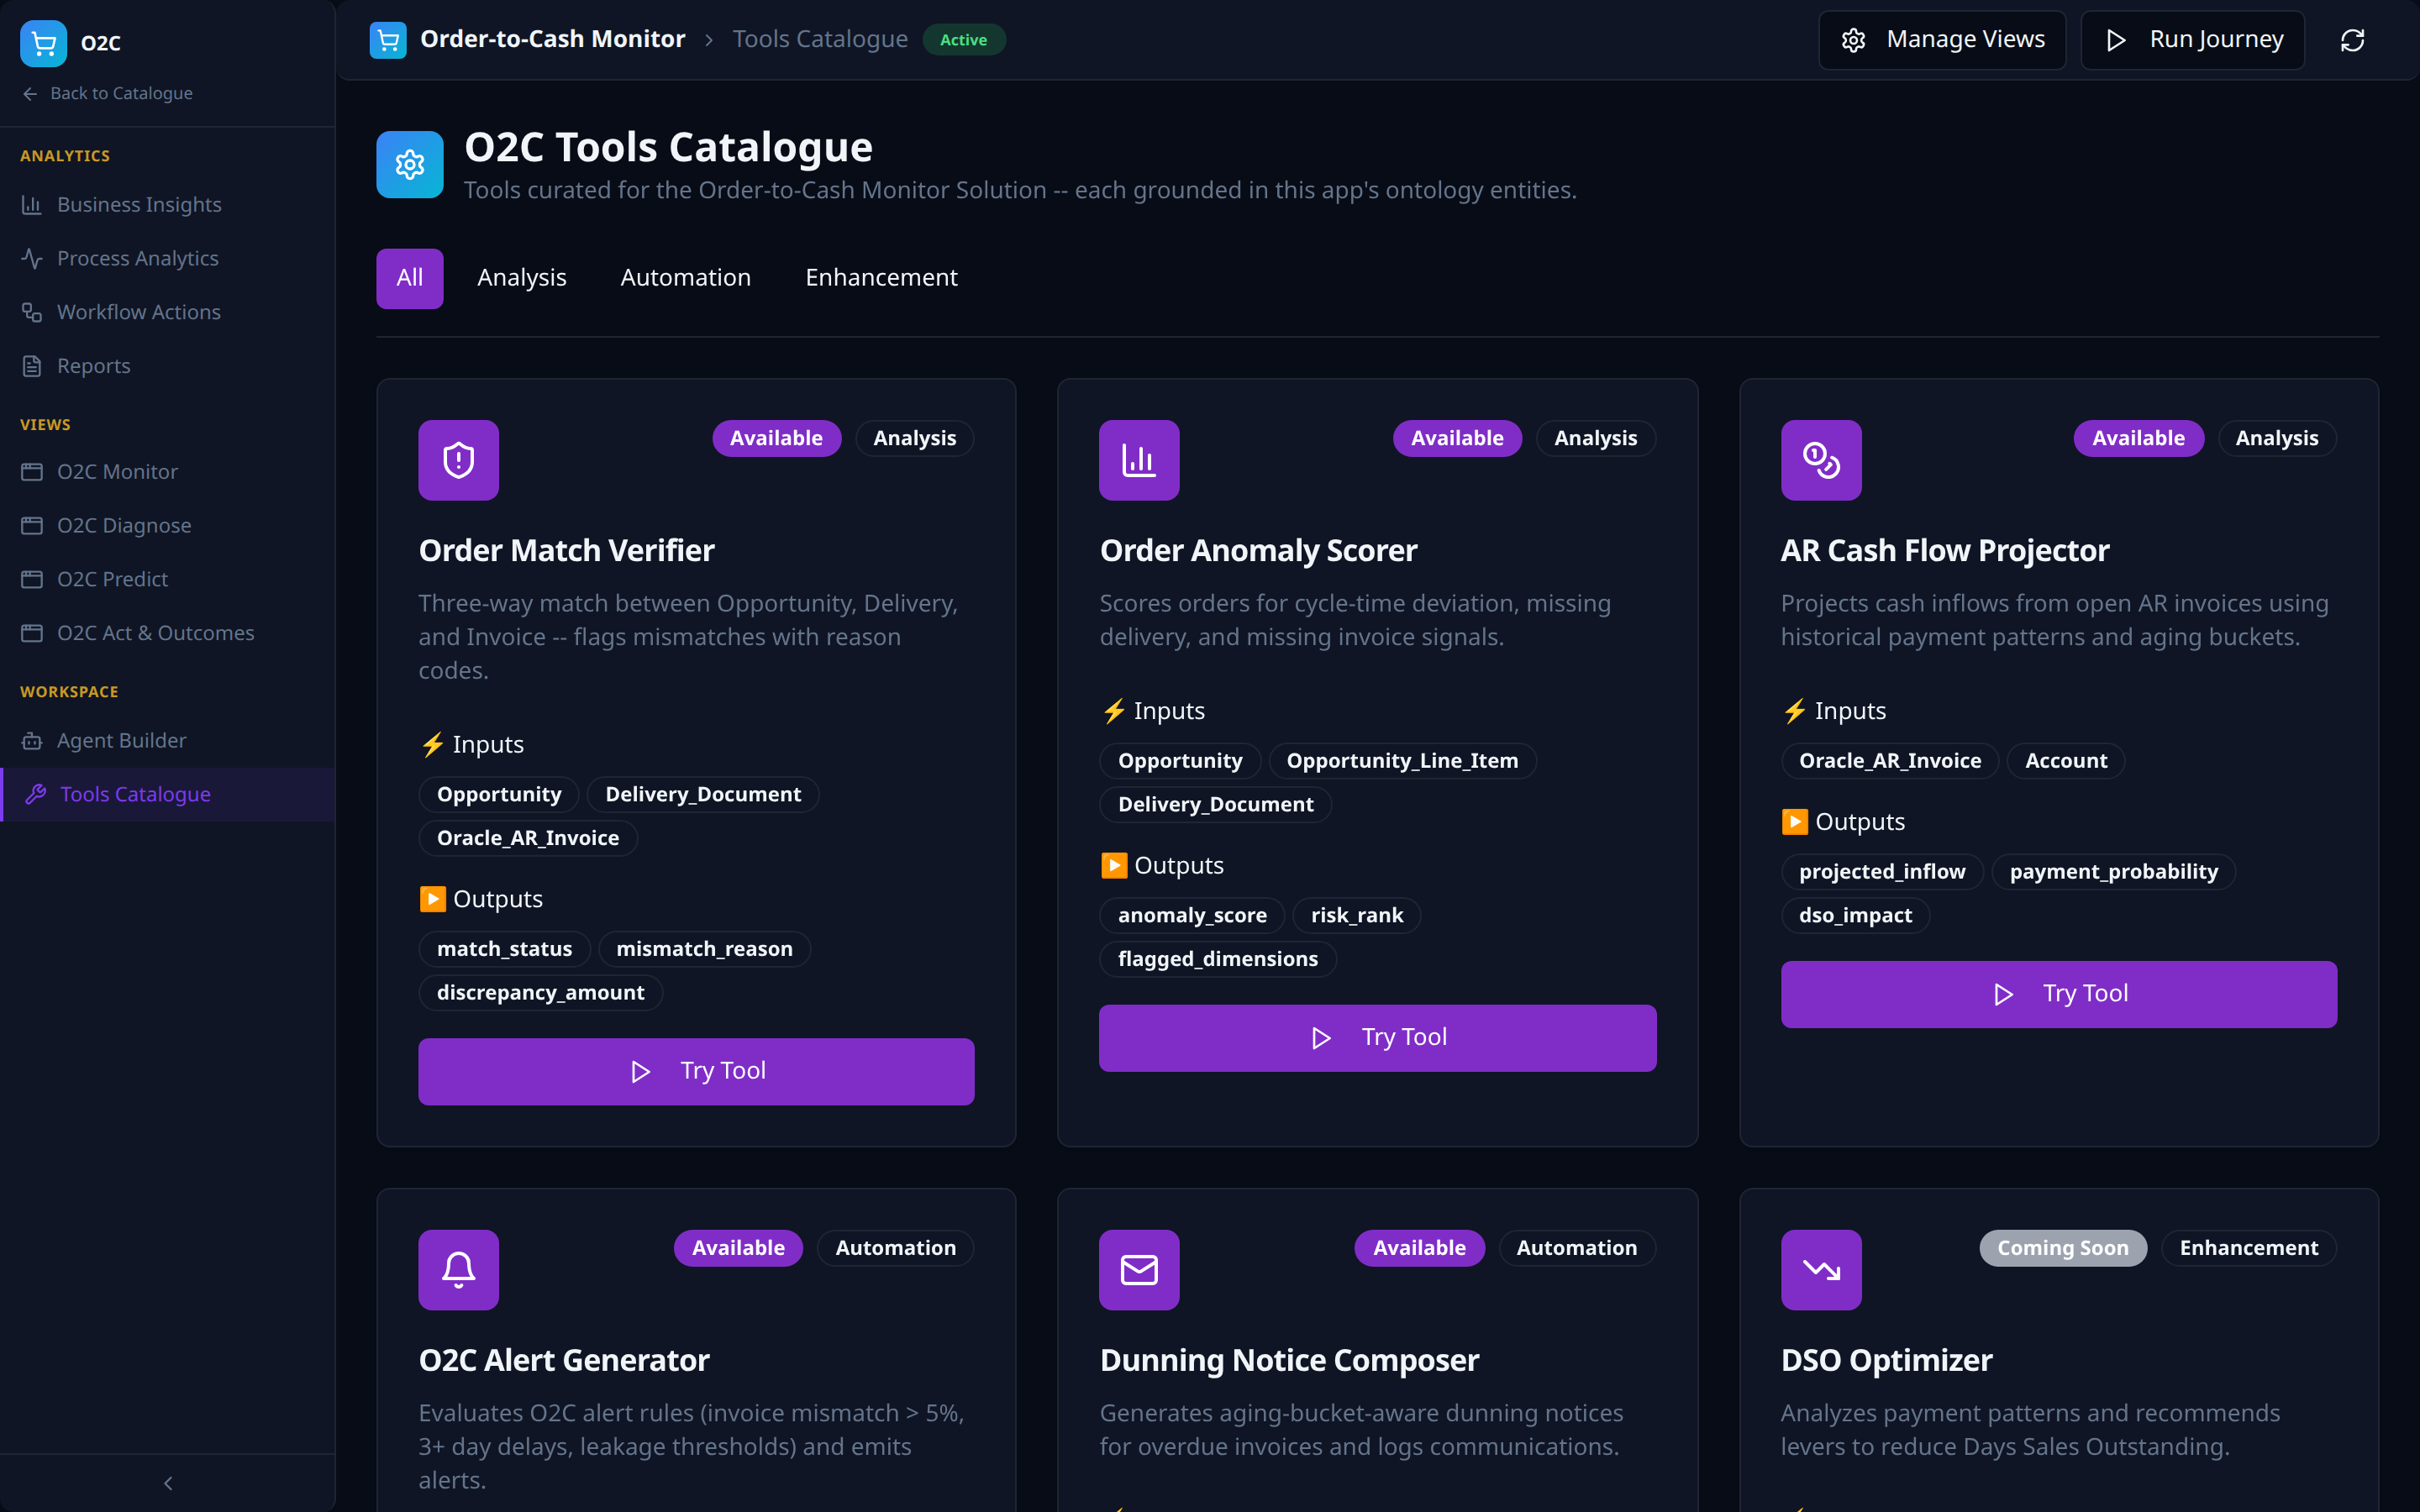
- App-curated -- the catalogue surfaces only tools relevant to this Solution, grounded in its ontology entities (for O2C: Order Match Verifier, Order Anomaly Scorer, AR Cash Flow Projector, O2C Alert Generator, Dunning Notice Composer, DSO Optimizer).
- Tool-type tabs are derived from the populated tools (Analysis, Automation, Enhancement here).
- Each card surfaces typed Inputs / Outputs (e.g.
Opportunity,Oracle_AR_Invoice->match_status,discrepancy_amount), availability (Available/Coming Soon), and aTry Toolaction.
AI Analytics
The AI Analytics layer is where the Virtual Data Layer is turned into business insight. It manages the lifecycle of dashboards and views -- the visual surfaces that consume ontology entities -- and binds them back to specific Solutions so each app gets its own purpose-built navigation.
Capabilities
| Component | Description |
|---|---|
| Dashboards | Multi-panel reports built on top of the VDL, classified by intent (Outcomes, Predict, Diagnose, Monitor) |
| Views | Reusable analytical surfaces -- the building blocks that get composed into Solution UIs |
| Four-Views Framework | Standard classification (Outcomes / Predict / Diagnose / Monitor) auto-seeded for every Solution |
| Solution Mapping | Bind Views to Solutions so each View shows up as a left-menu item in its Solution UI |
| Search & Tags | Free-text search plus typed tags (four-views, outcomes, monitor, customer-360, esg-sustainability, etc.) |
AI Analytics Walkthrough
The AI Analytics workspace is exposed through three tabs in the NexusAI workspace -- covering browsing, authoring, and binding of dashboards and views -- plus a multi-step Dashboard Builder drill-down reached from the + New Dashboard action on the Dashboards tab.
Dashboards
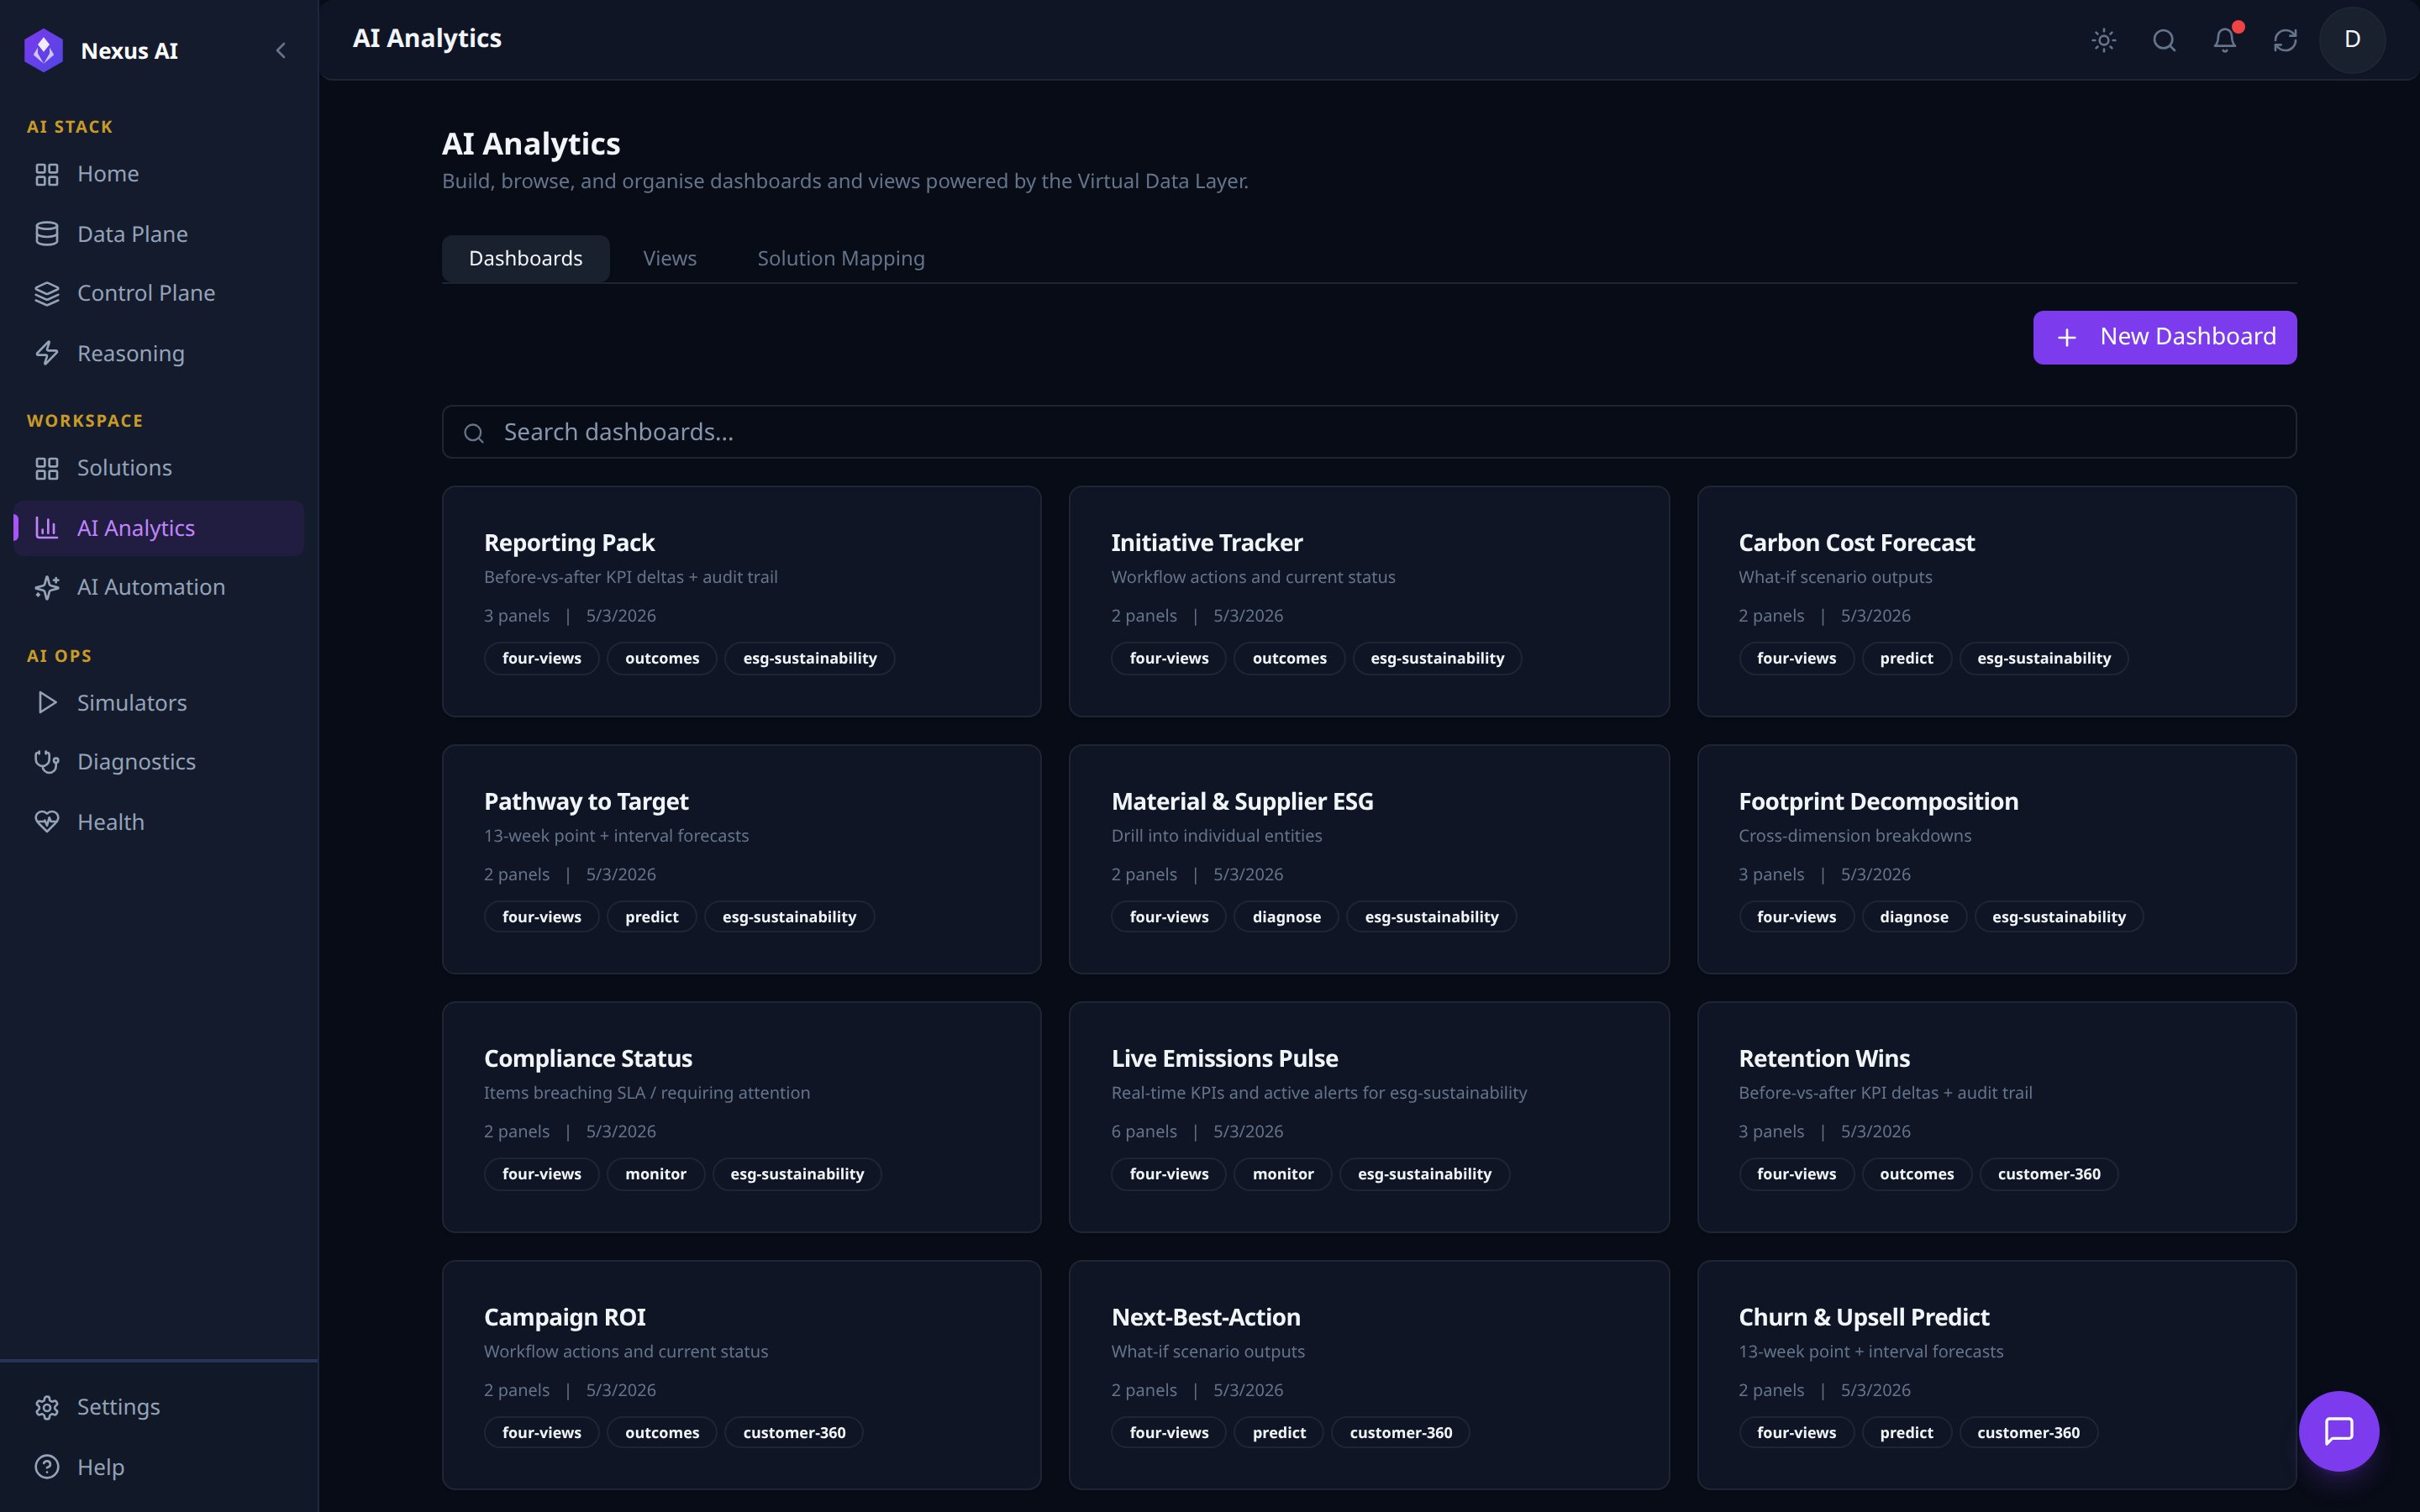
Card grid of every dashboard in the workspace.
- Card metadata -- name, one-line description, panel count, last-updated date.
- Tags -- classification (
outcomes/predict/diagnose/monitor) plus the target Solution slug, so dashboards are searchable by intent and by Solution. - Author --
+ New Dashboardopens the Dashboard Builder.
Views
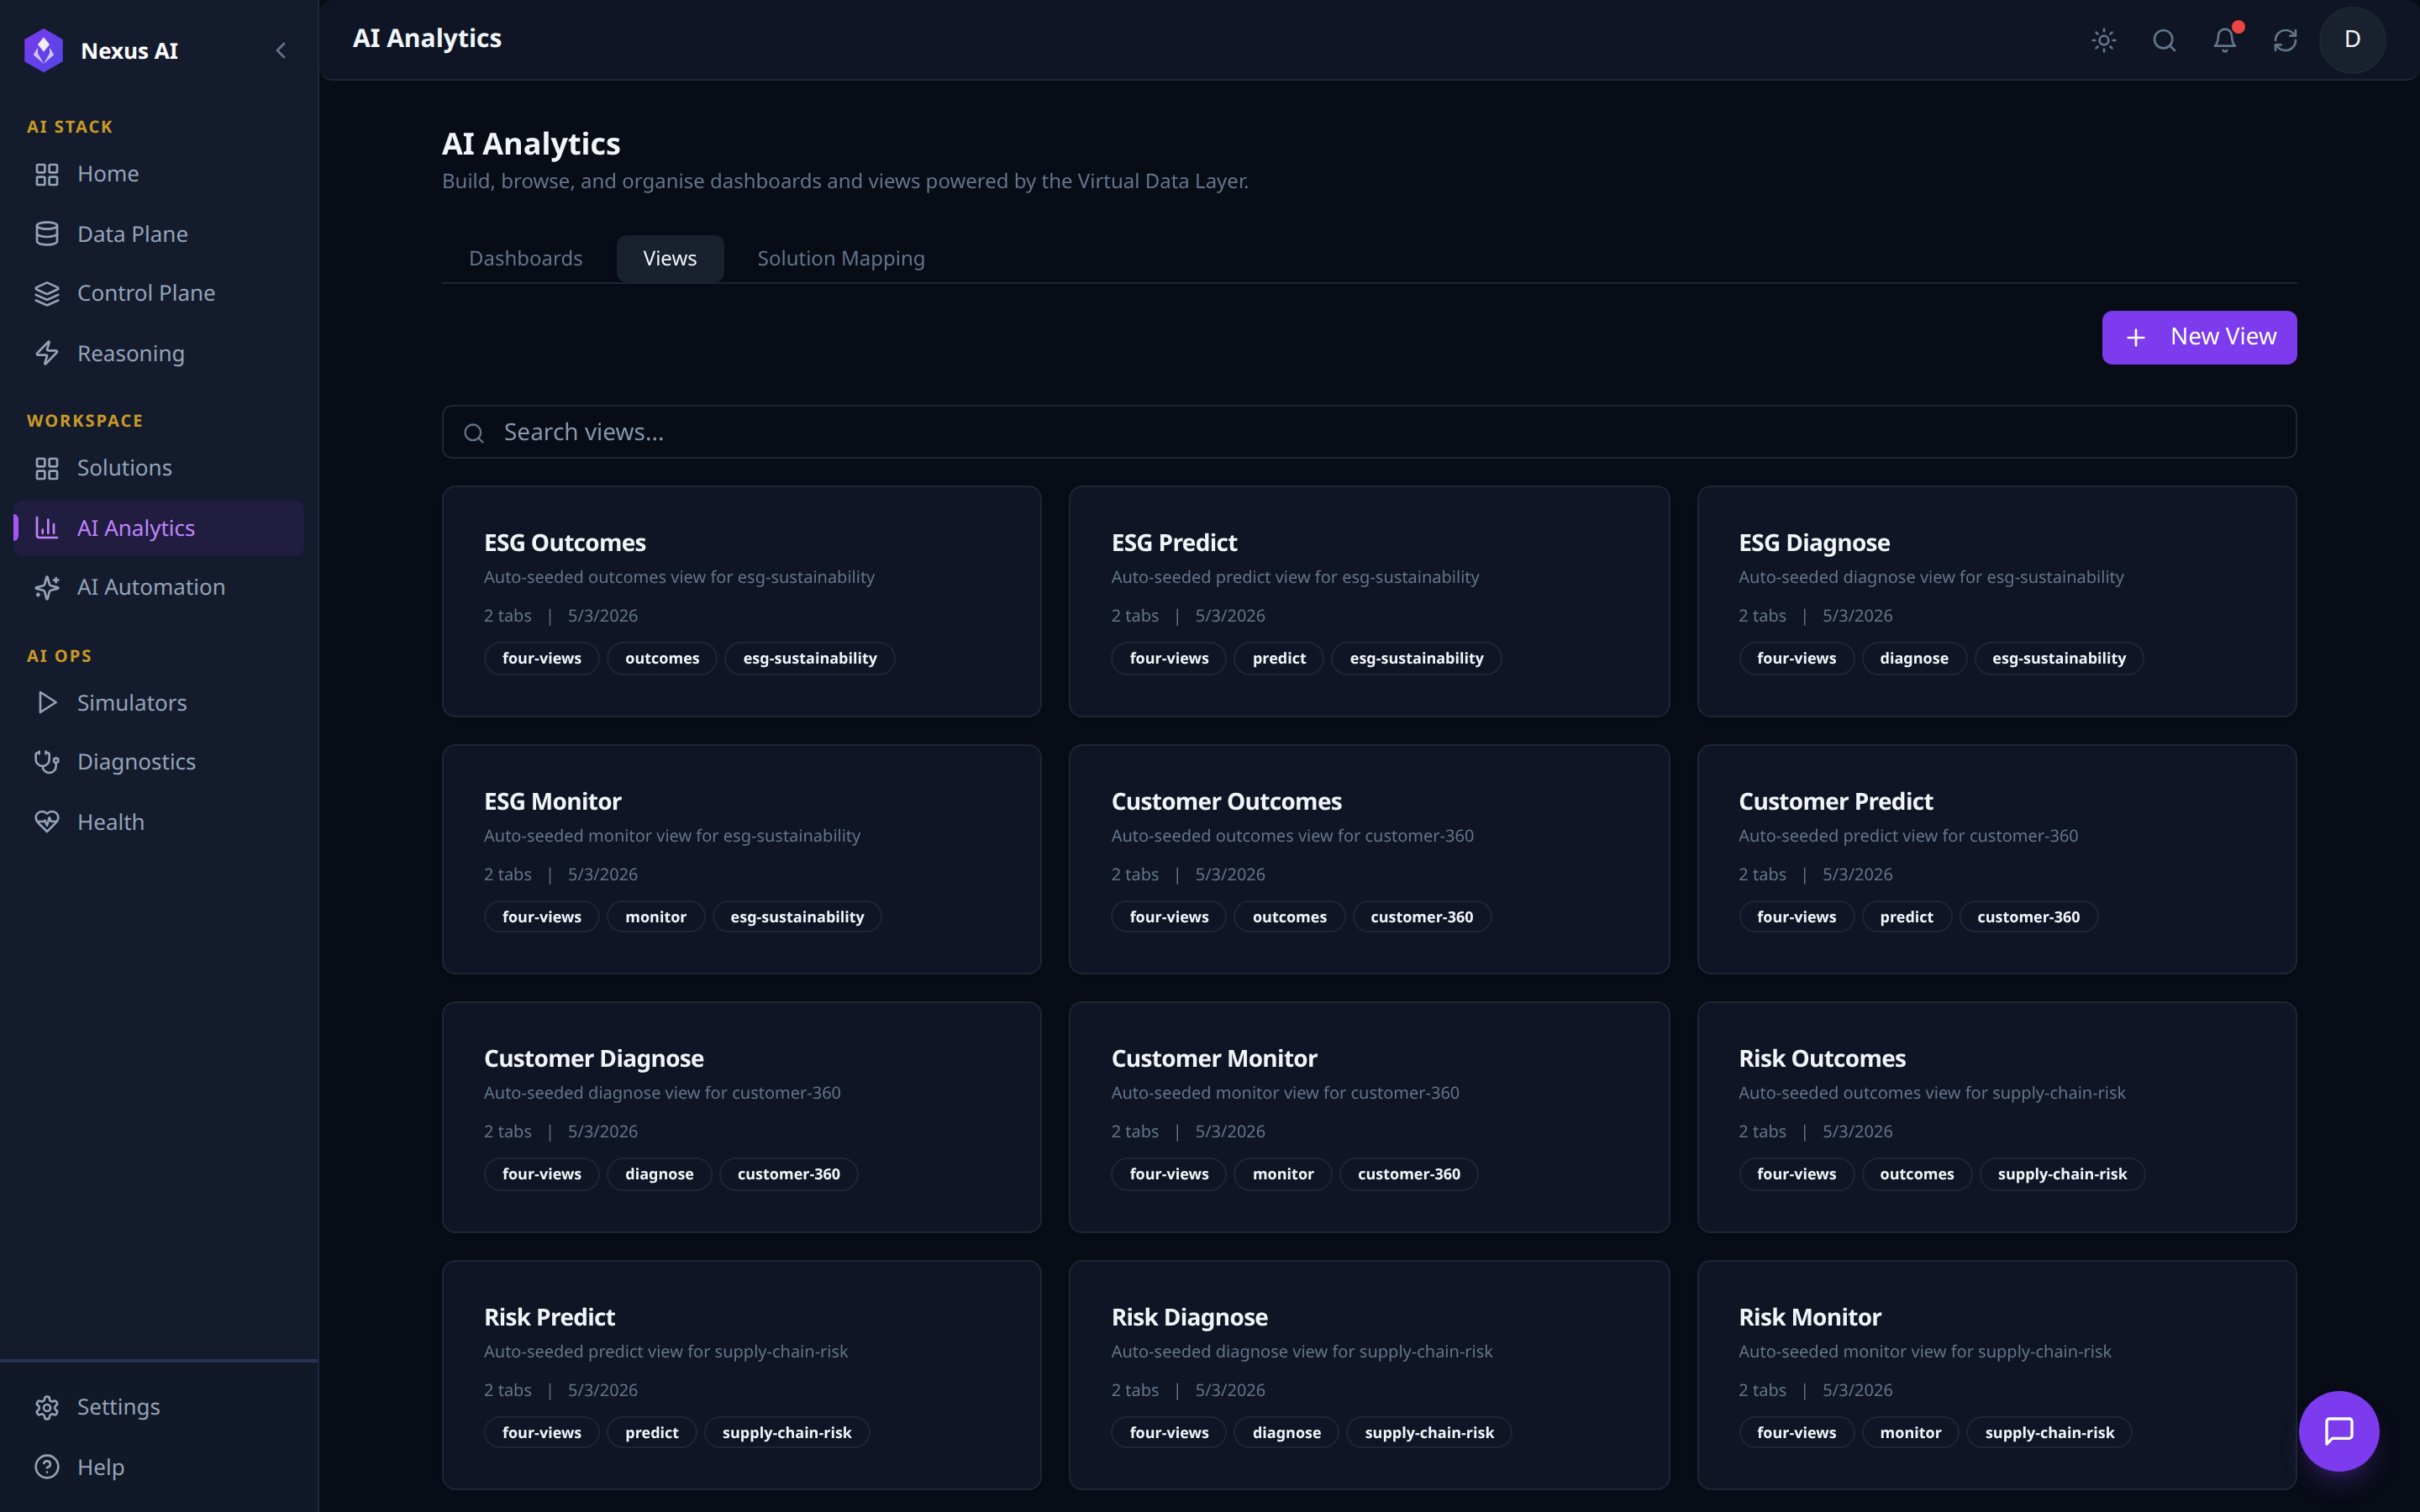
Catalogue of reusable Views -- the analytical building blocks that compose into Solution UIs.
- Four-views framework -- every Solution is auto-seeded with four Views: Outcomes, Predict, Diagnose, Monitor.
- Card metadata -- classification + solution tags, sub-tab count, last-updated date.
- Author --
+ New Viewfor custom surfaces beyond the auto-seeded set.
Solution Mapping
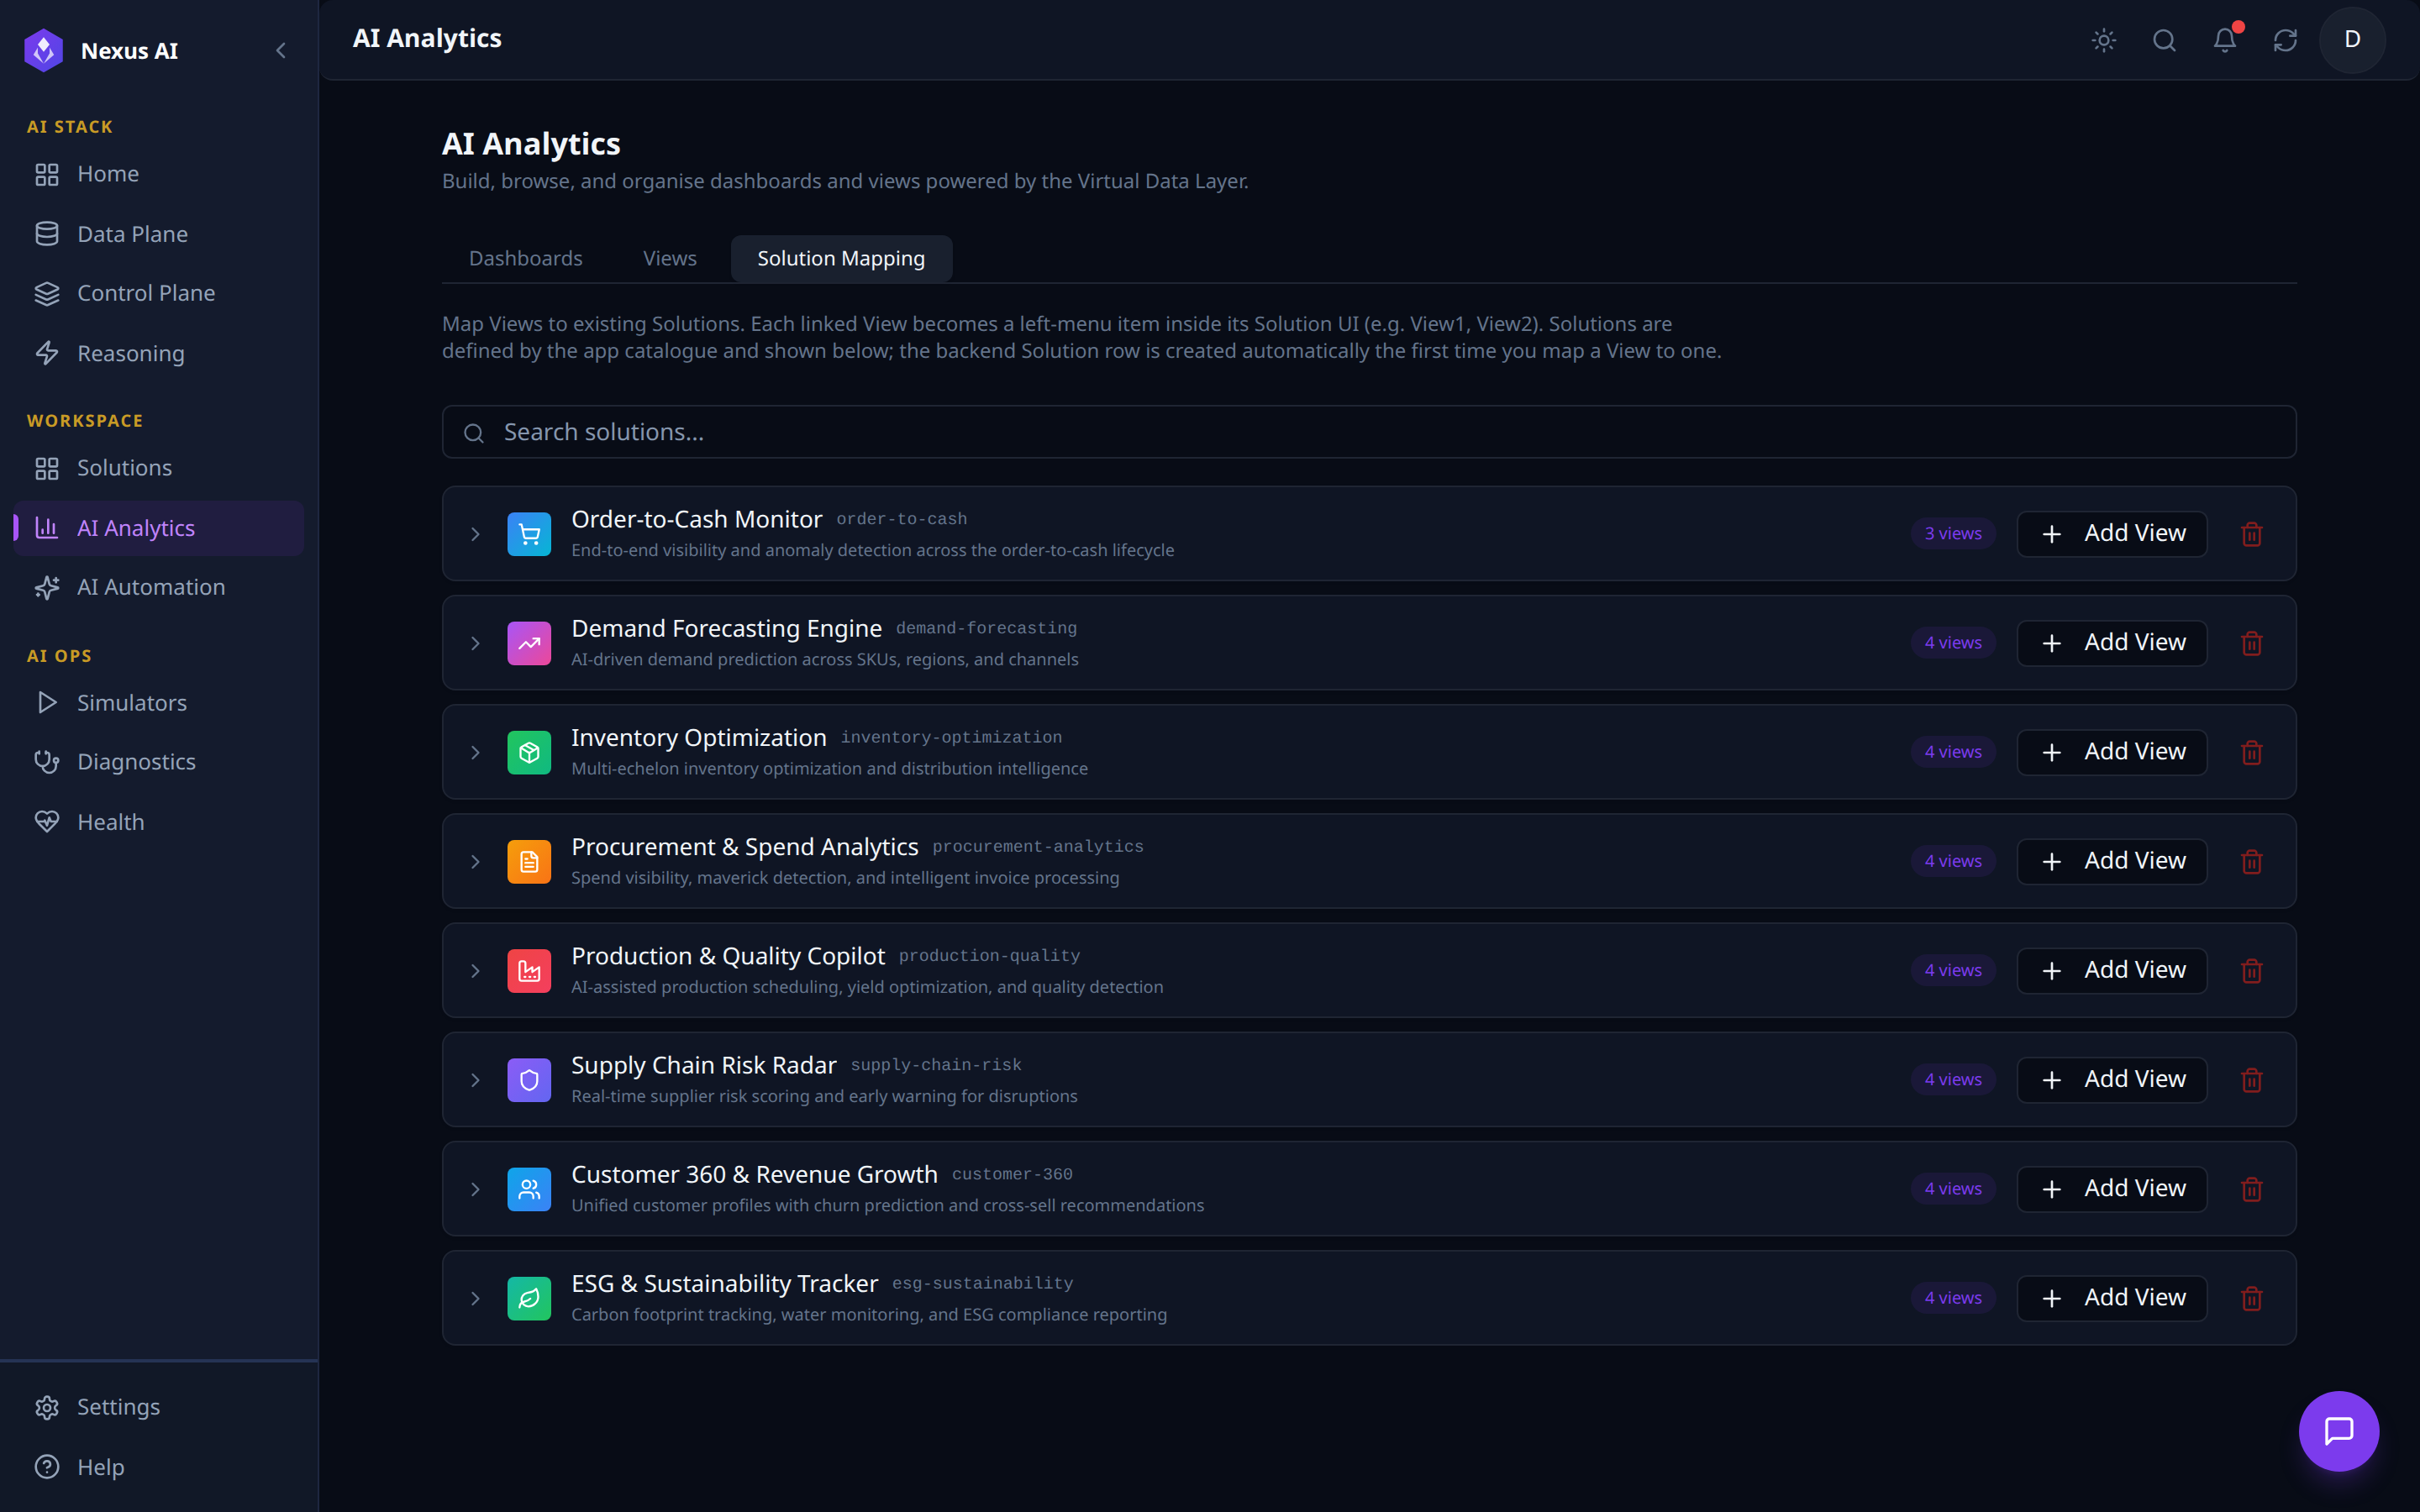
Editor for binding Views to Solutions -- each linked View becomes a left-menu item inside its Solution UI.
- One row per catalogue Solution with current view count and slug.
- Per-row actions --
+ Add Viewto bind another, trash icon to unmap all. - Auto-provisioning -- the backend Solution row is created the first time a View is mapped to it.
Dashboard Builder
The Dashboard Builder is the multi-step canvas reached by clicking + New Dashboard on the Dashboards tab. It walks the author through three stages: pick a panel type, wire up its data with the AI Query Builder, and watch the visualisation render against the Virtual Data Layer.
1. Pick a panel type from the Add Panel catalogue.
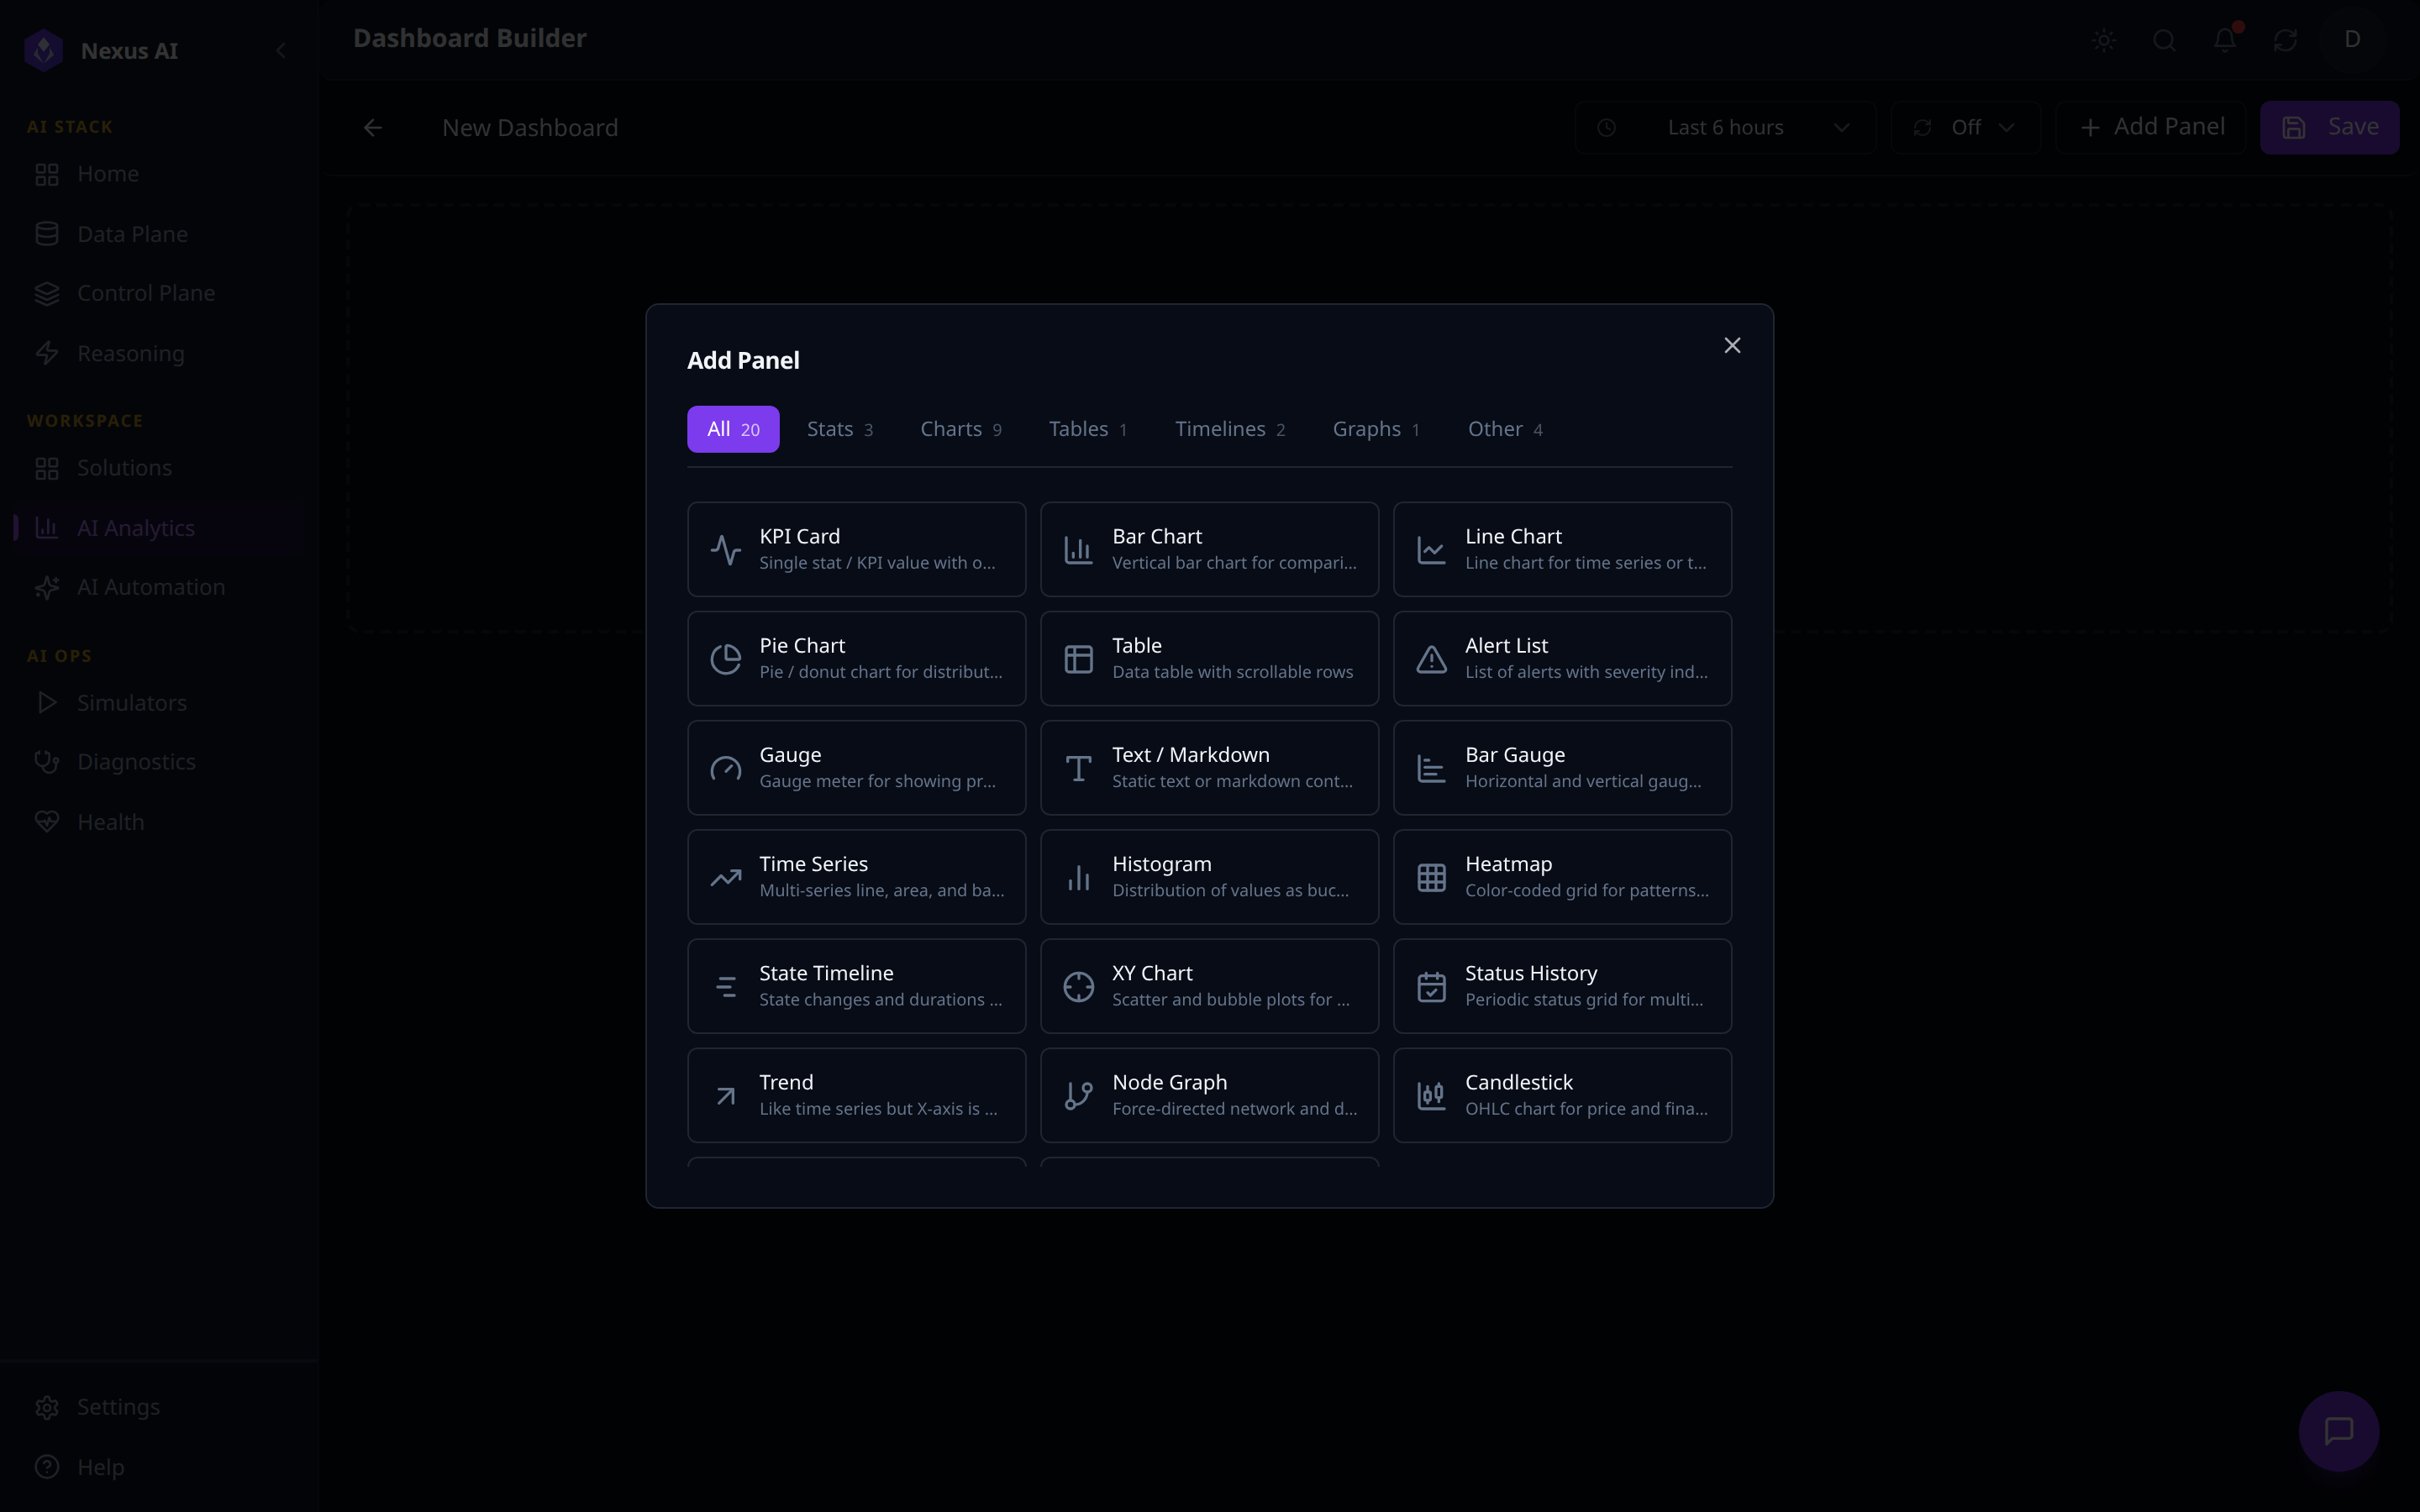
- 20 built-in panel types across 7 categories (Stats, Charts, Tables, Timelines, Graphs, Other) -- KPI Card, Bar / Line / Pie Chart, Table, Gauge, Heatmap, Time Series, Histogram, Node Graph, etc.
- Toolbar -- dashboard title, time-range picker, auto-refresh,
+ Add Panel,Save.
2. Wire the panel up with the AI Query Builder.
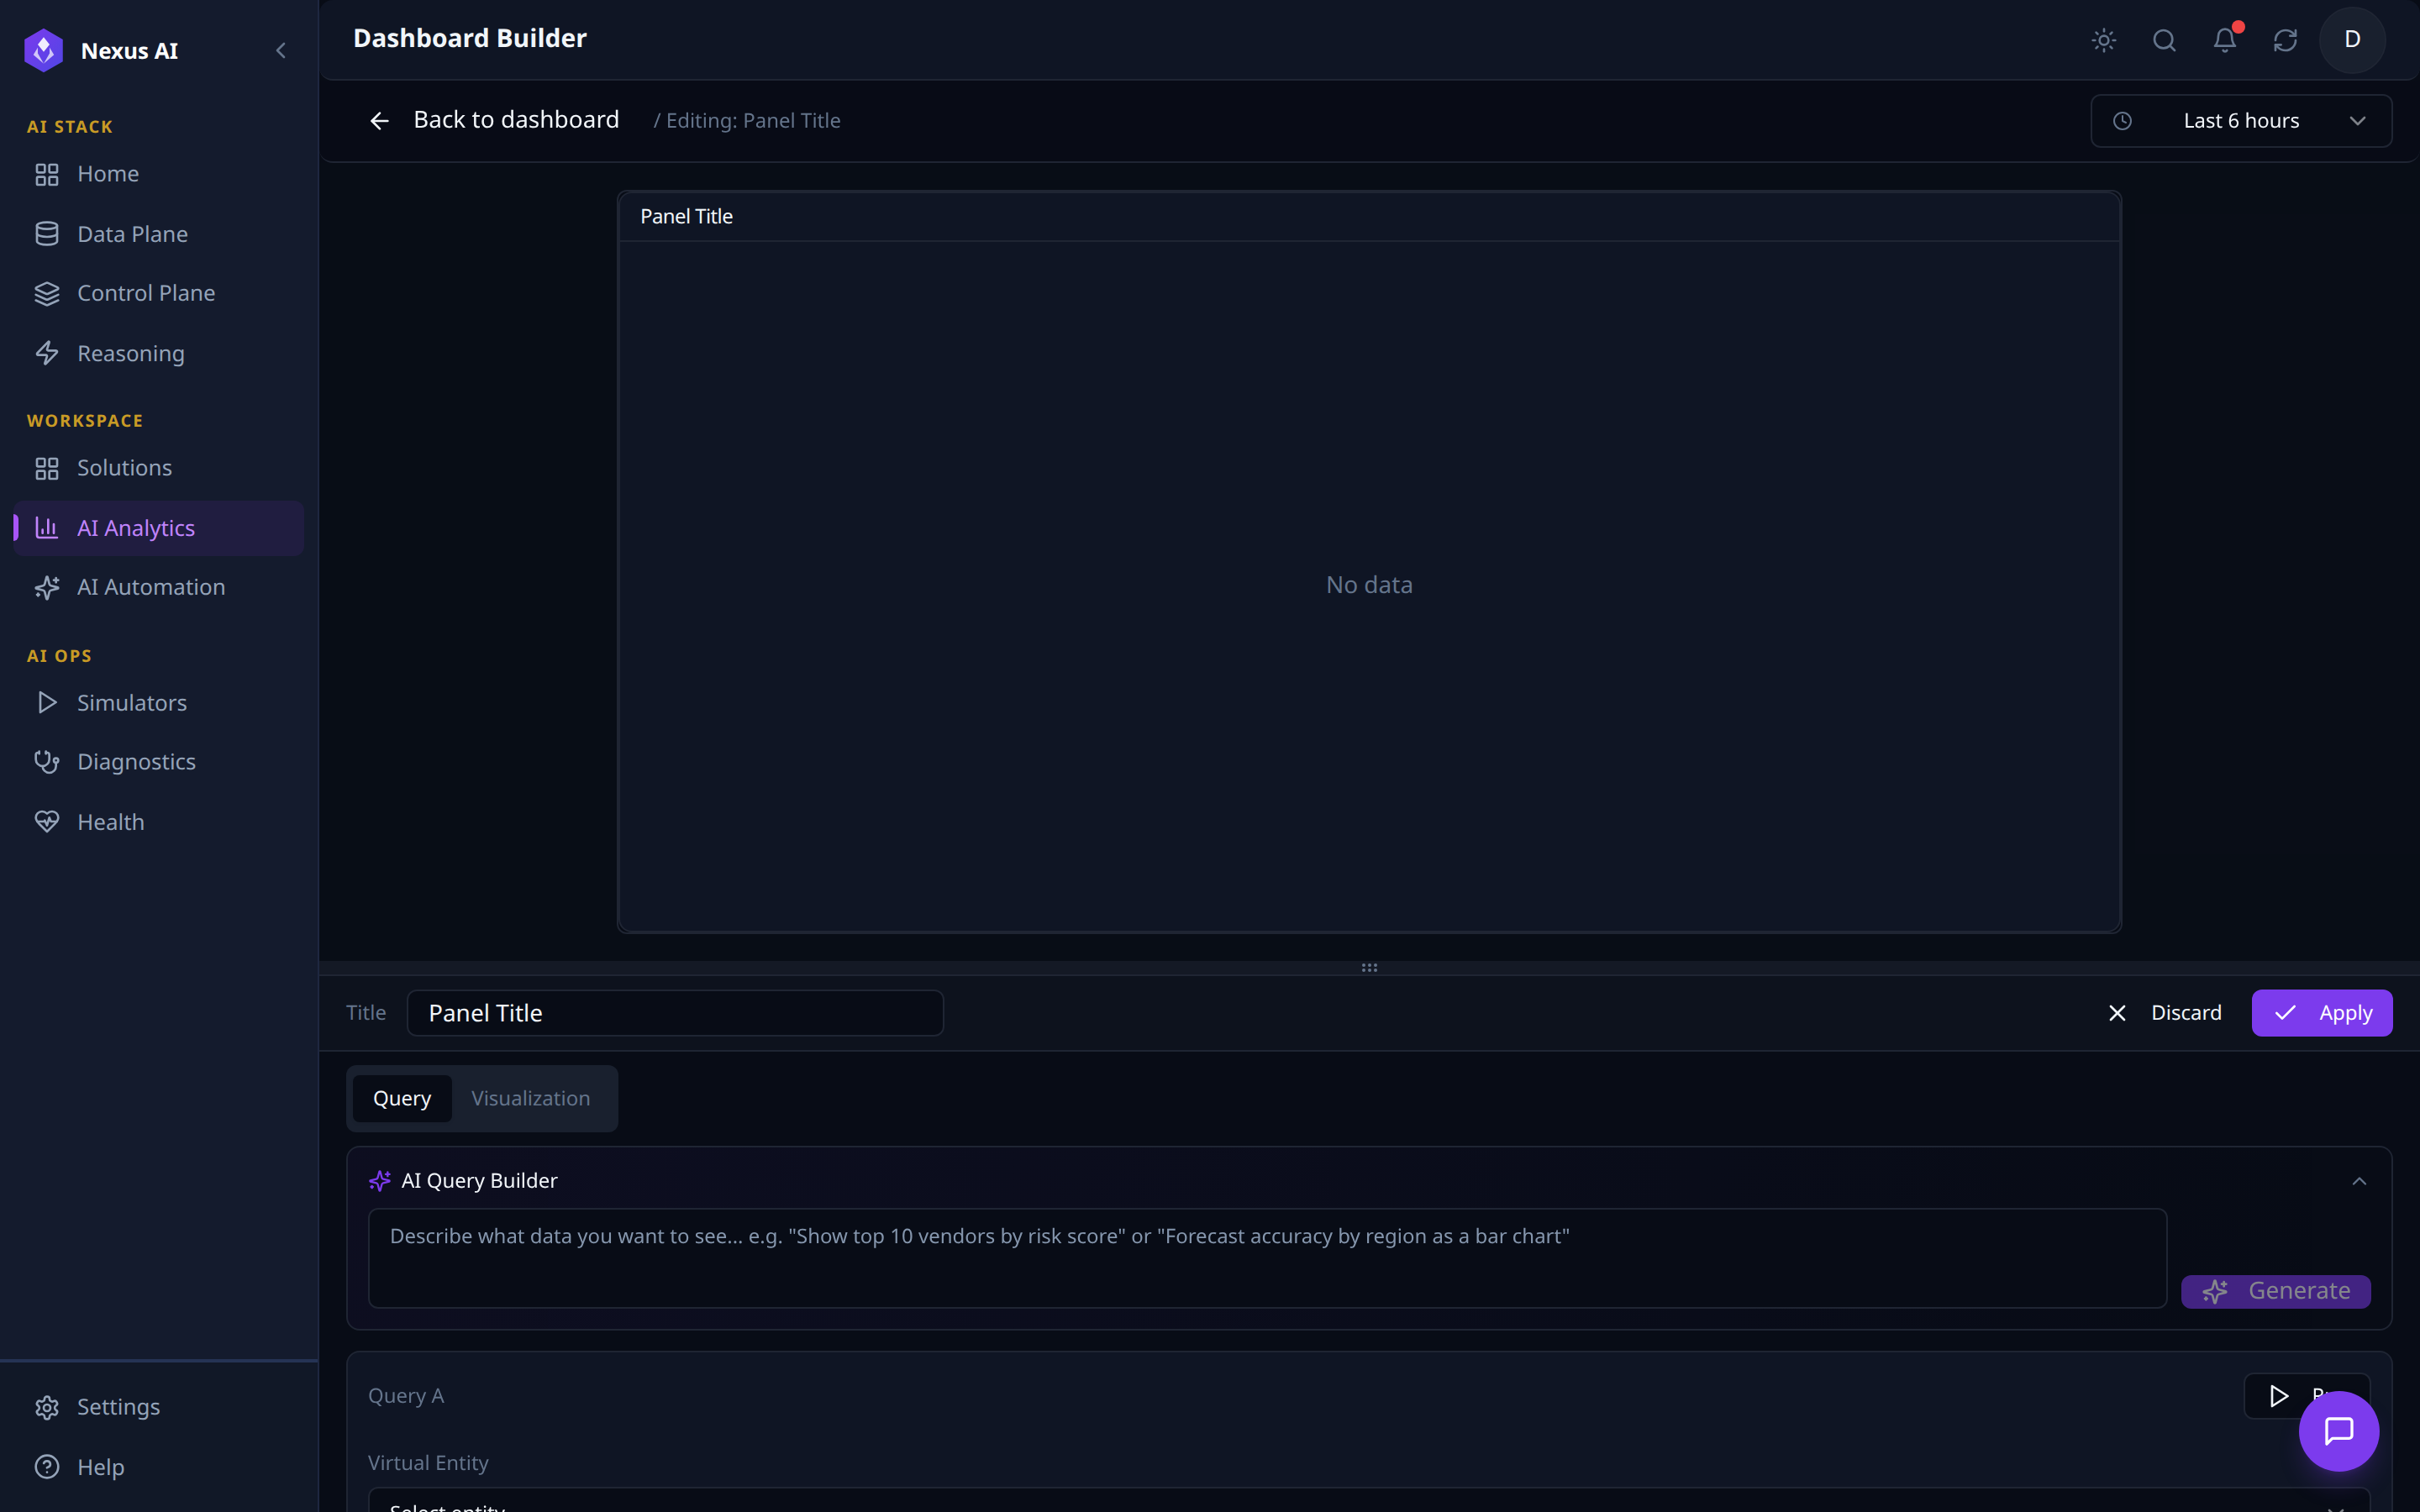
- Two-pane editor -- live preview canvas above, configuration pane below with
Query/Visualizationtabs. - AI Query Builder -- natural-language prompt that generates a structured query.
- Structured Query block -- Virtual Entity selector, fields, filters; runs against the VDL whether authored by hand or via the AI Query Builder.
3. Generate, run, and the visualisation renders live.
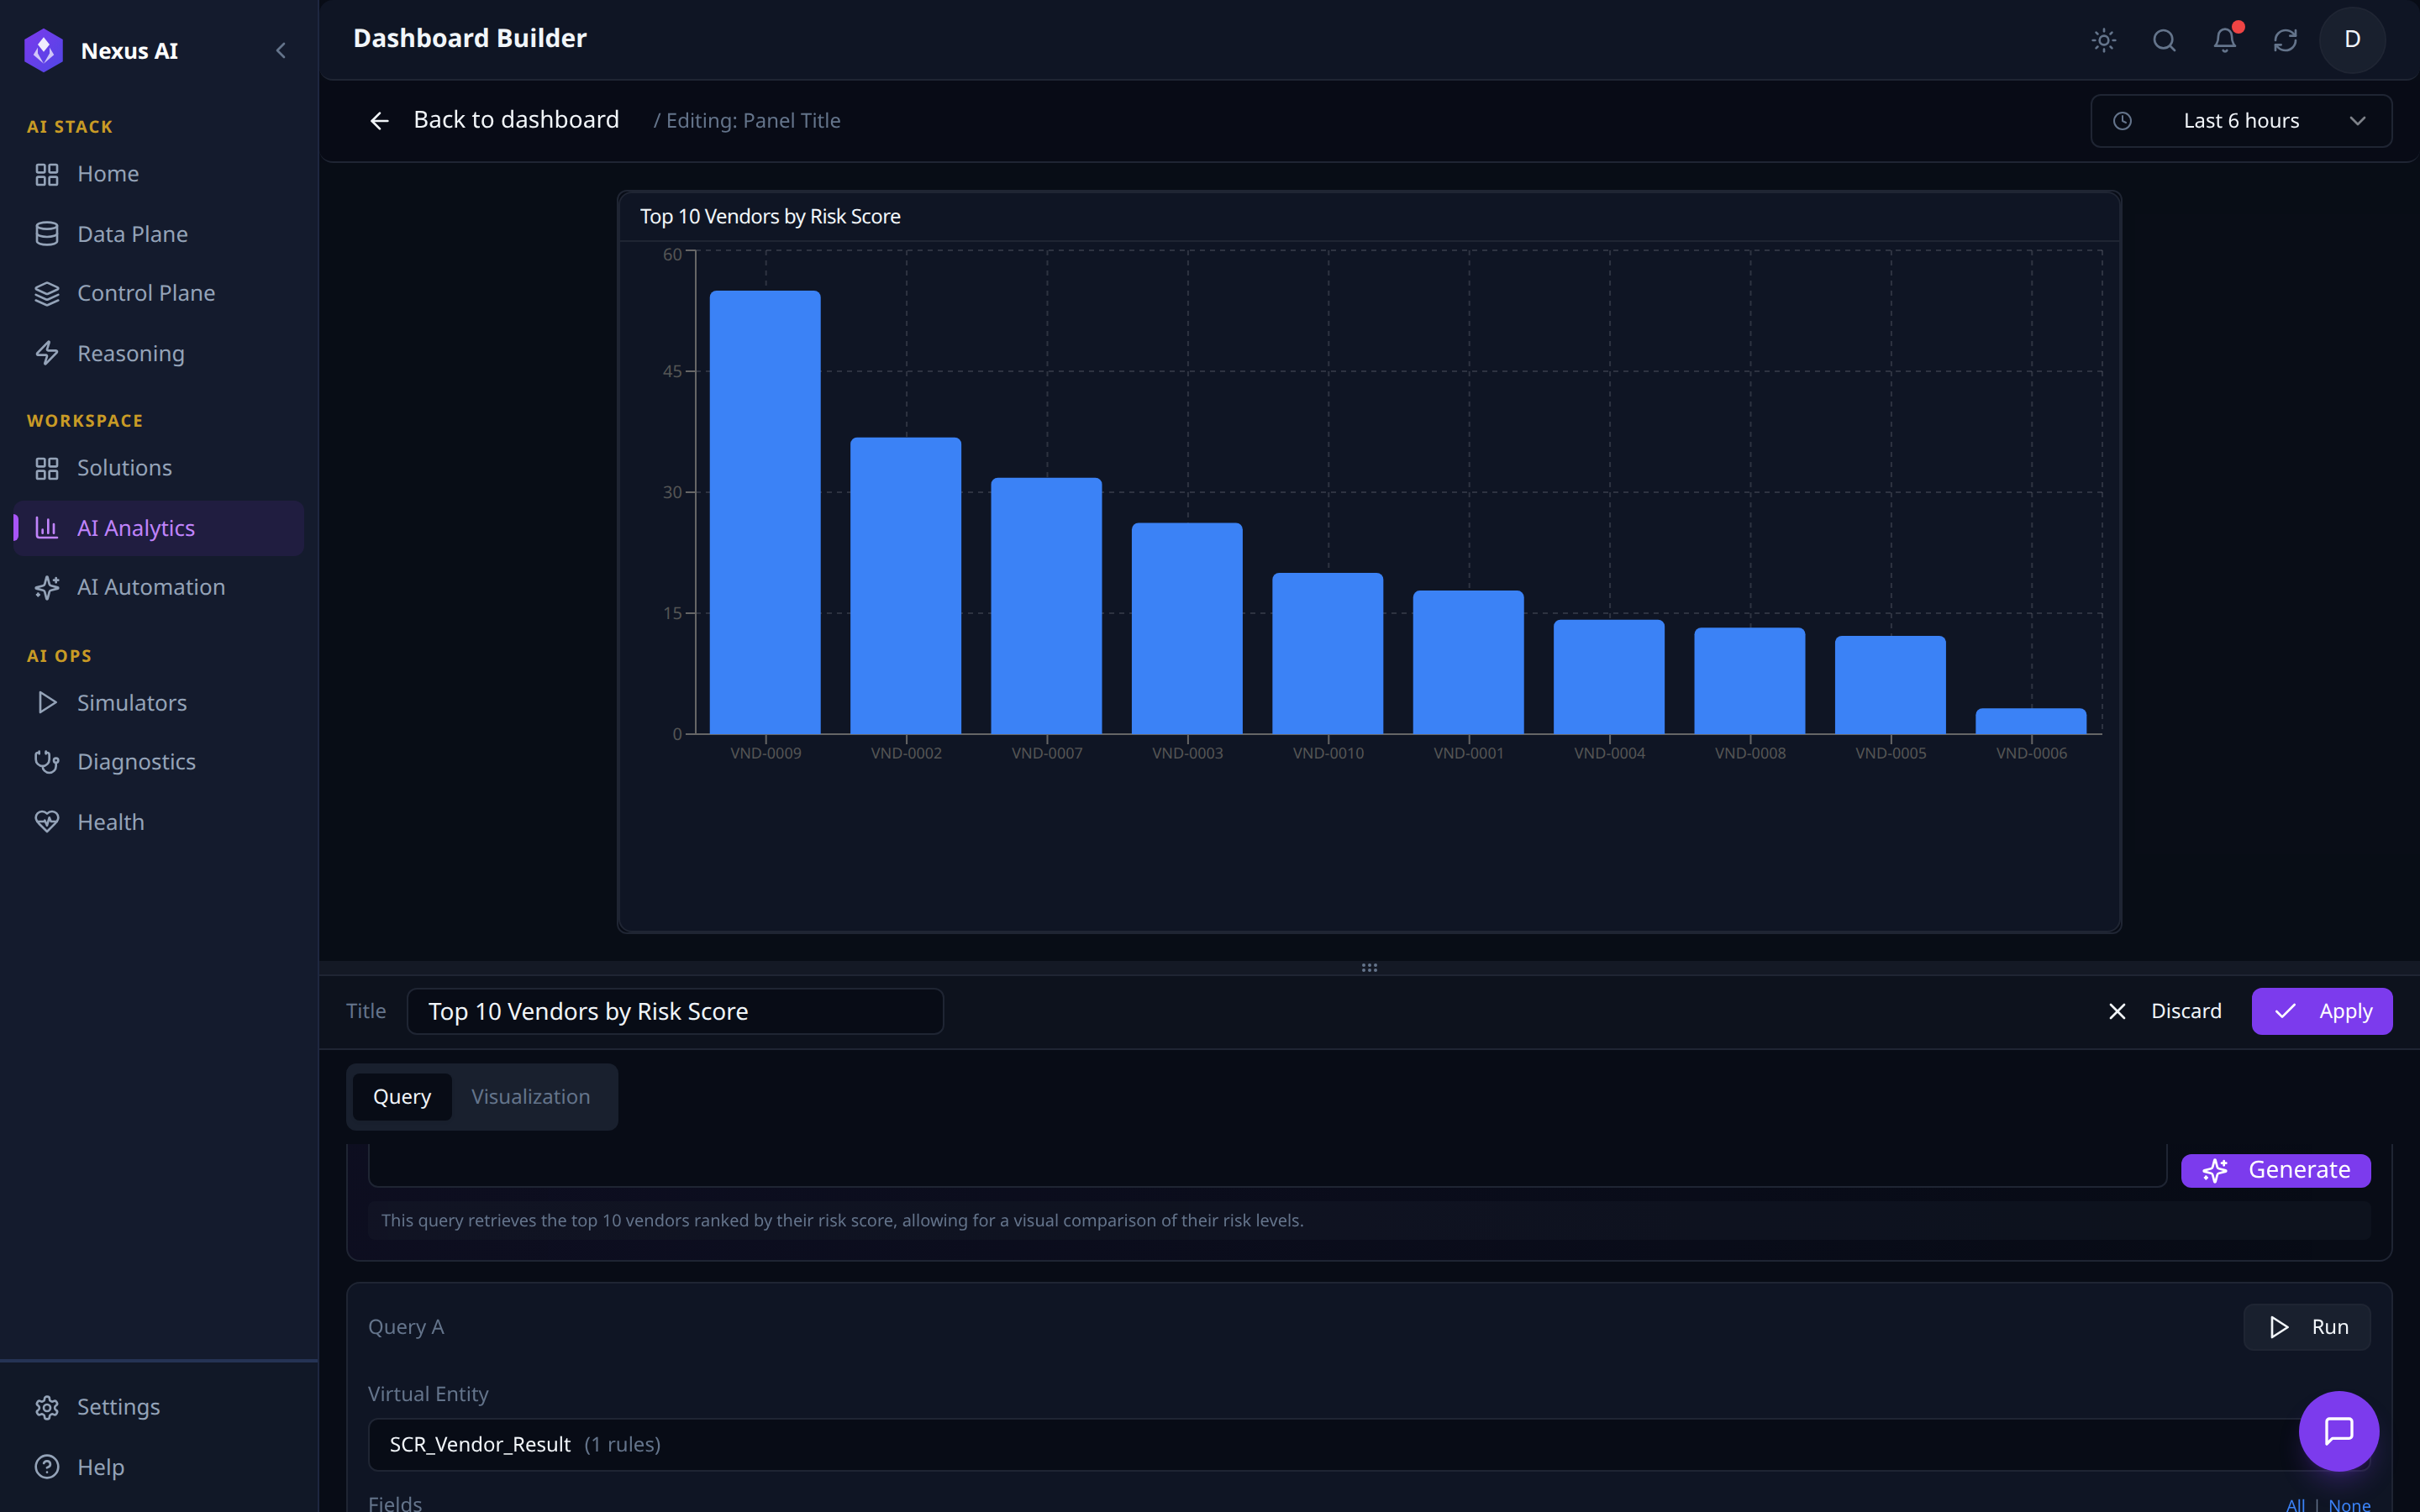
- Generate -- the AI Query Builder fills the structured query, auto-titles the panel, and emits a one-line description of what was queried.
- Live render -- chart paints against the resolved Virtual Entity (e.g.
SCR_Vendor_Result). - Persist --
Applyadds the panel to the dashboard;Visualizationtab refines axes / colours / thresholds.
AI Automation
The AI Automation layer is the journey engine -- the runtime that turns reasoning into repeatable, scheduled, multi-step business operations. Where the Reasoning Plane handles ad-hoc agentic queries, AI Automation handles the production workflows: scheduled ETL, call processing, semantic RAG indexing, and per-Solution operational journeys.
Capabilities
| Component | Description |
|---|---|
| Journeys | Multi-step pipelines with persistent run history, success/failure metrics, and audit trail |
| Journey Templates | Pre-wired journey starters per Solution and per pipeline type (Call Processing, Semantic RAG, O2C, Demand Forecasting, Inventory Optimization, Procurement, Production & Quality, Supply Chain Risk, Customer 360, ESG) |
| AI Copilot Journey | Natural-language journey planner -- describe the goal, get a draft journey back |
| Journey Builder | Visual drag-and-drop builder with a typed Tool Palette, Step Editor, and validate/save/run controls |
| Triggers | Manual / Schedule / Webhook execution modes |
| Tool Palette | Categorised, searchable catalogue of registered tools (Core, Supply Chain, O2C, Write, ...) the journey can call |
Journey Lifecycle
graph LR
    Author["Author<br/>(Builder or AI Copilot)"] --> Validate["Validate"]
    Validate --> Save["Save"]
    Save --> Trigger["Trigger<br/>Manual / Schedule / Webhook"]
    Trigger --> Run["Run<br/>Step-by-step execution"]
    Run --> Observe["Observe<br/>Jobs / Done / Running / Failed"]
    Observe --> Audit["Audit Trail"]
AI Automation Walkthrough
The AI Automation workspace is exposed through three tabs in the NexusAI workspace -- covering operations, conversational authoring, and visual authoring -- plus a per-journey Journey Studio drill-down view reached from any Journey card.
Journeys
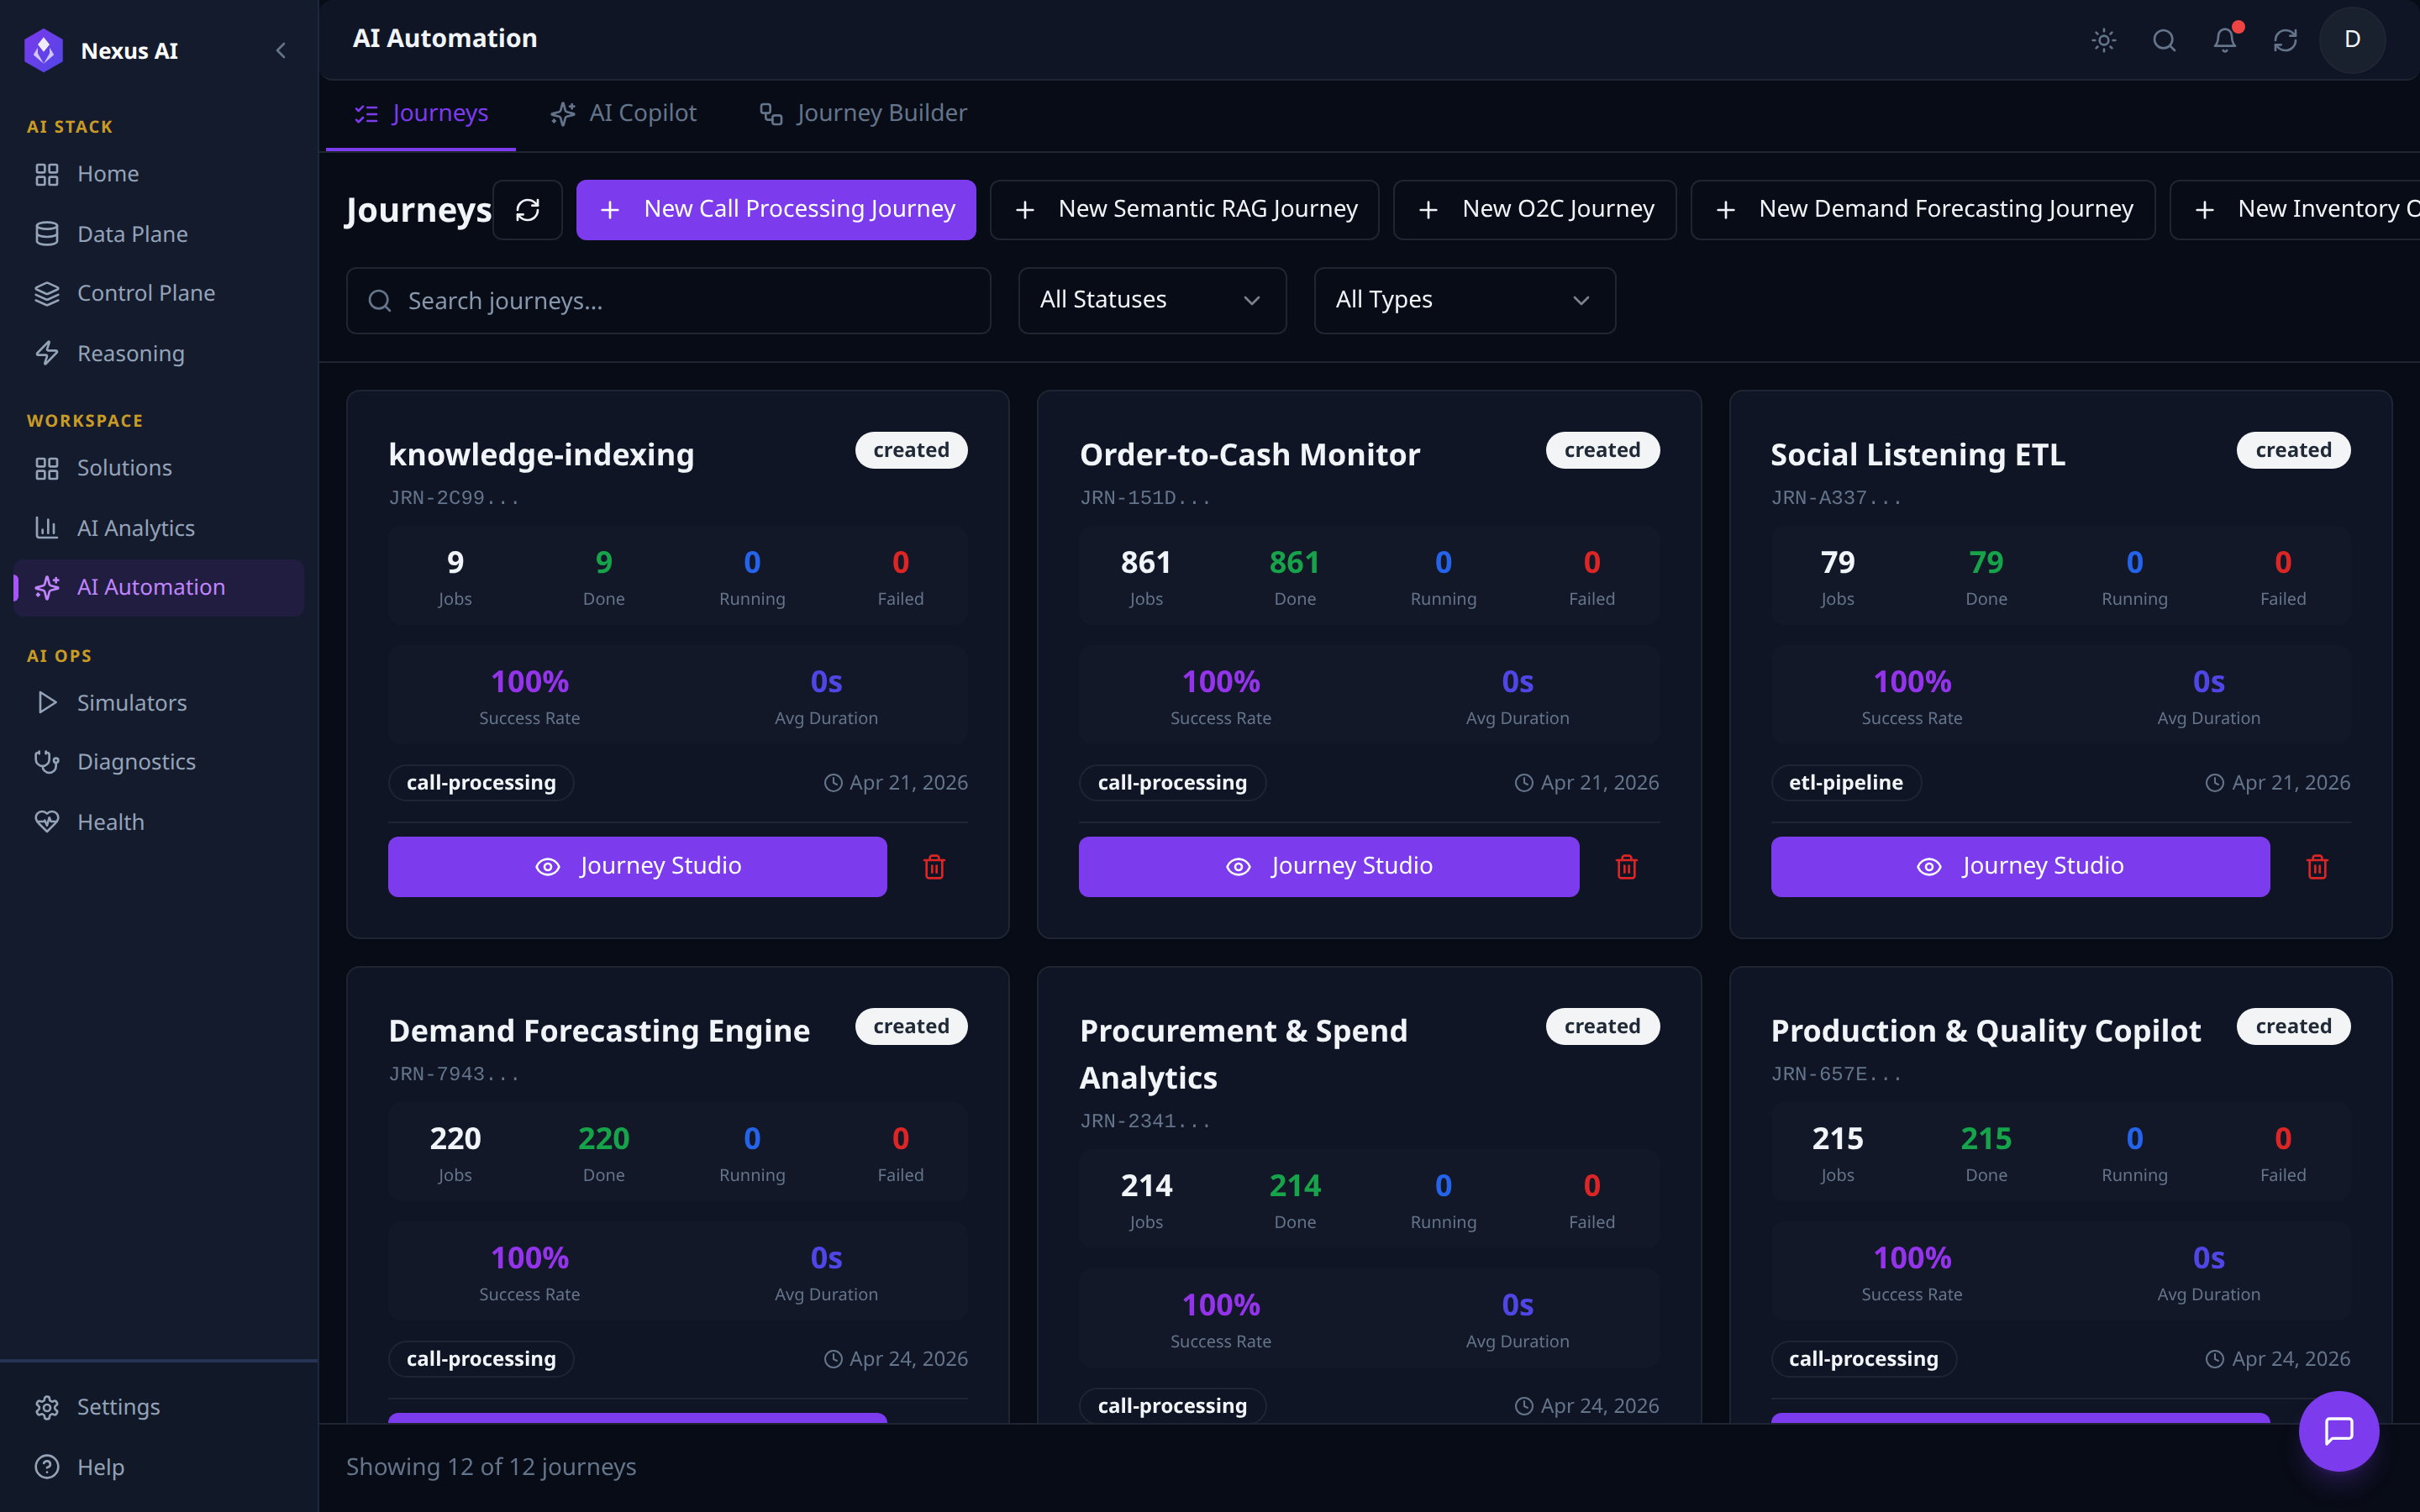
Operational dashboard for every journey running on the platform.
- Templates -- one
+ New … Journeyper pipeline type (Call Processing, Semantic RAG, plus one per Solution). - Filters -- status, type, free-text search.
- Card metadata -- JRN-id, type chip, status badge, run counters (
Jobs / Done / Running / Failed),Success Rate,Avg Duration. - Drill-in --
Journey Studioopens the per-journey operations console.
AI Copilot
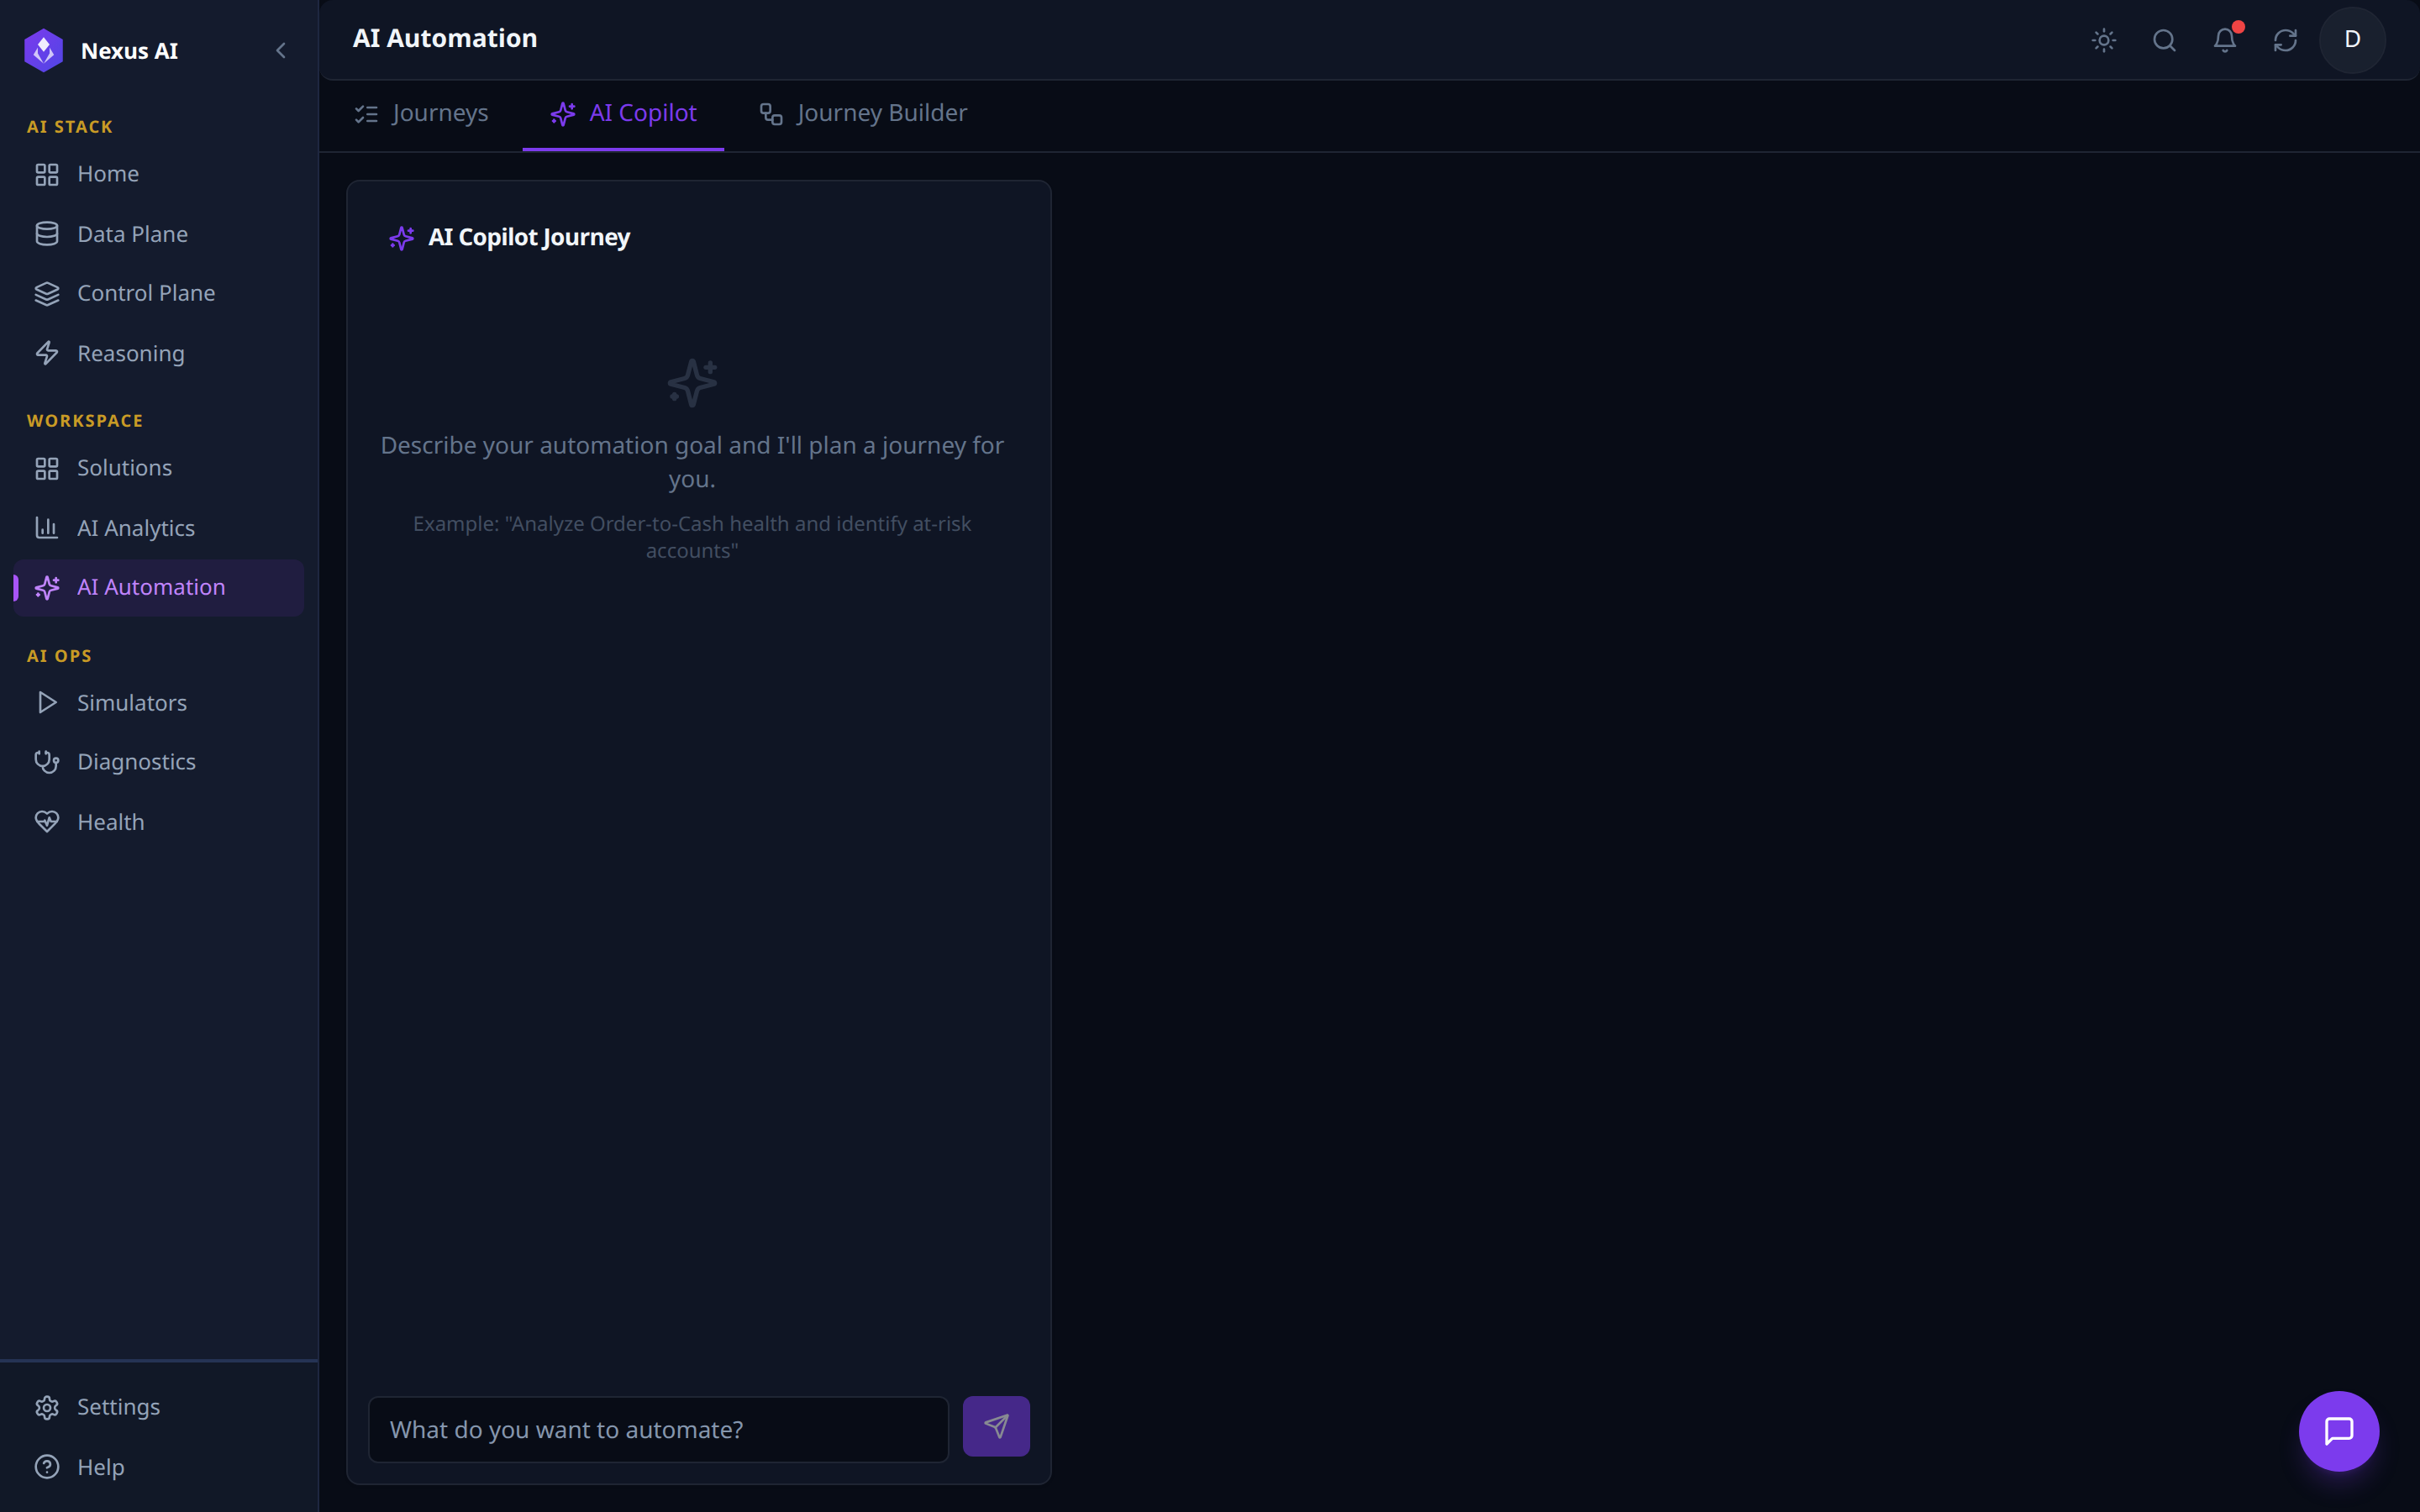
Conversational on-ramp to the journey runtime.
- Natural-language input -- "Describe your automation goal and I'll plan a journey for you."
- Output -- a draft journey of typed steps, ready for refinement in the Journey Builder before save / run.
- Same tool registry as the visual builder -- the Copilot is a planner, not a separate engine.
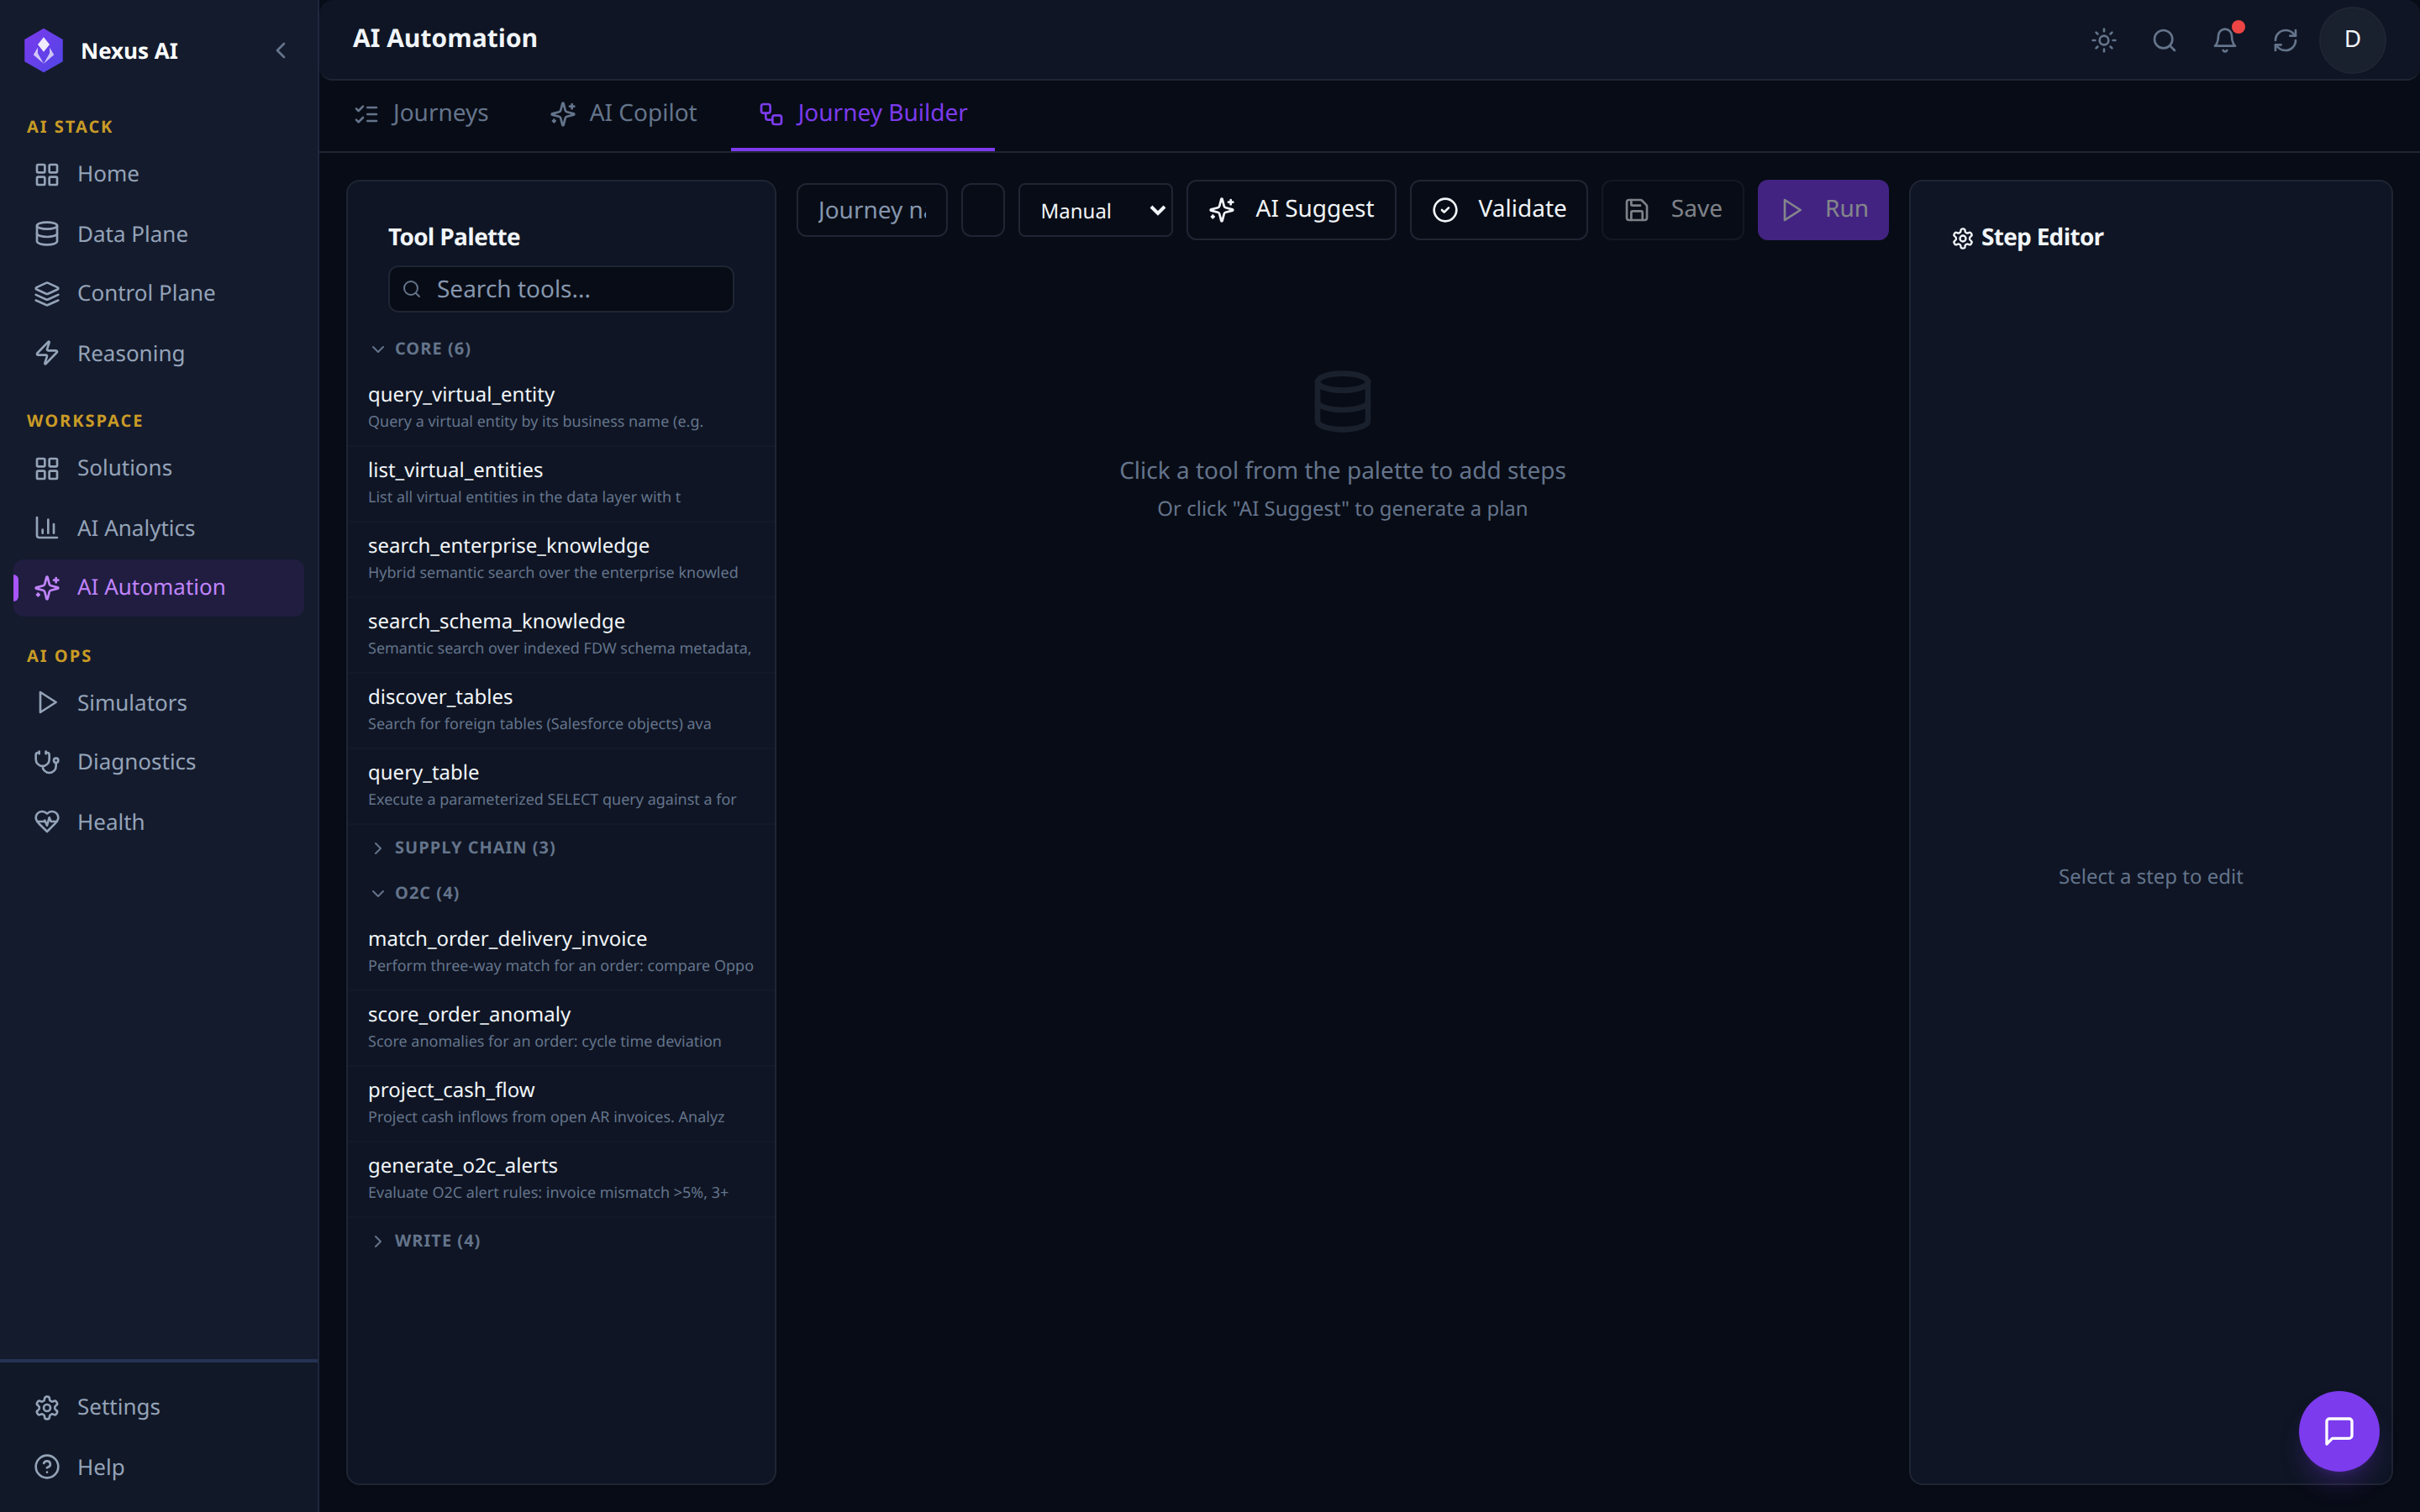
Journey Builder
Three-pane visual authoring surface for journeys.
- Top toolbar -- journey metadata, trigger type (
Manual/Schedule/Webhook), and run controls (AI Suggest,Validate,Save,Run). - Tool Palette (left) -- every registered tool grouped by category (CORE, SUPPLY CHAIN, O2C, WRITE, …) with per-category counts and free-text search.
- Canvas (centre) -- step graph; populated by clicking a tool or invoking
AI Suggest. - Step Editor (right) -- per-step configuration: inputs, outputs, policy settings.
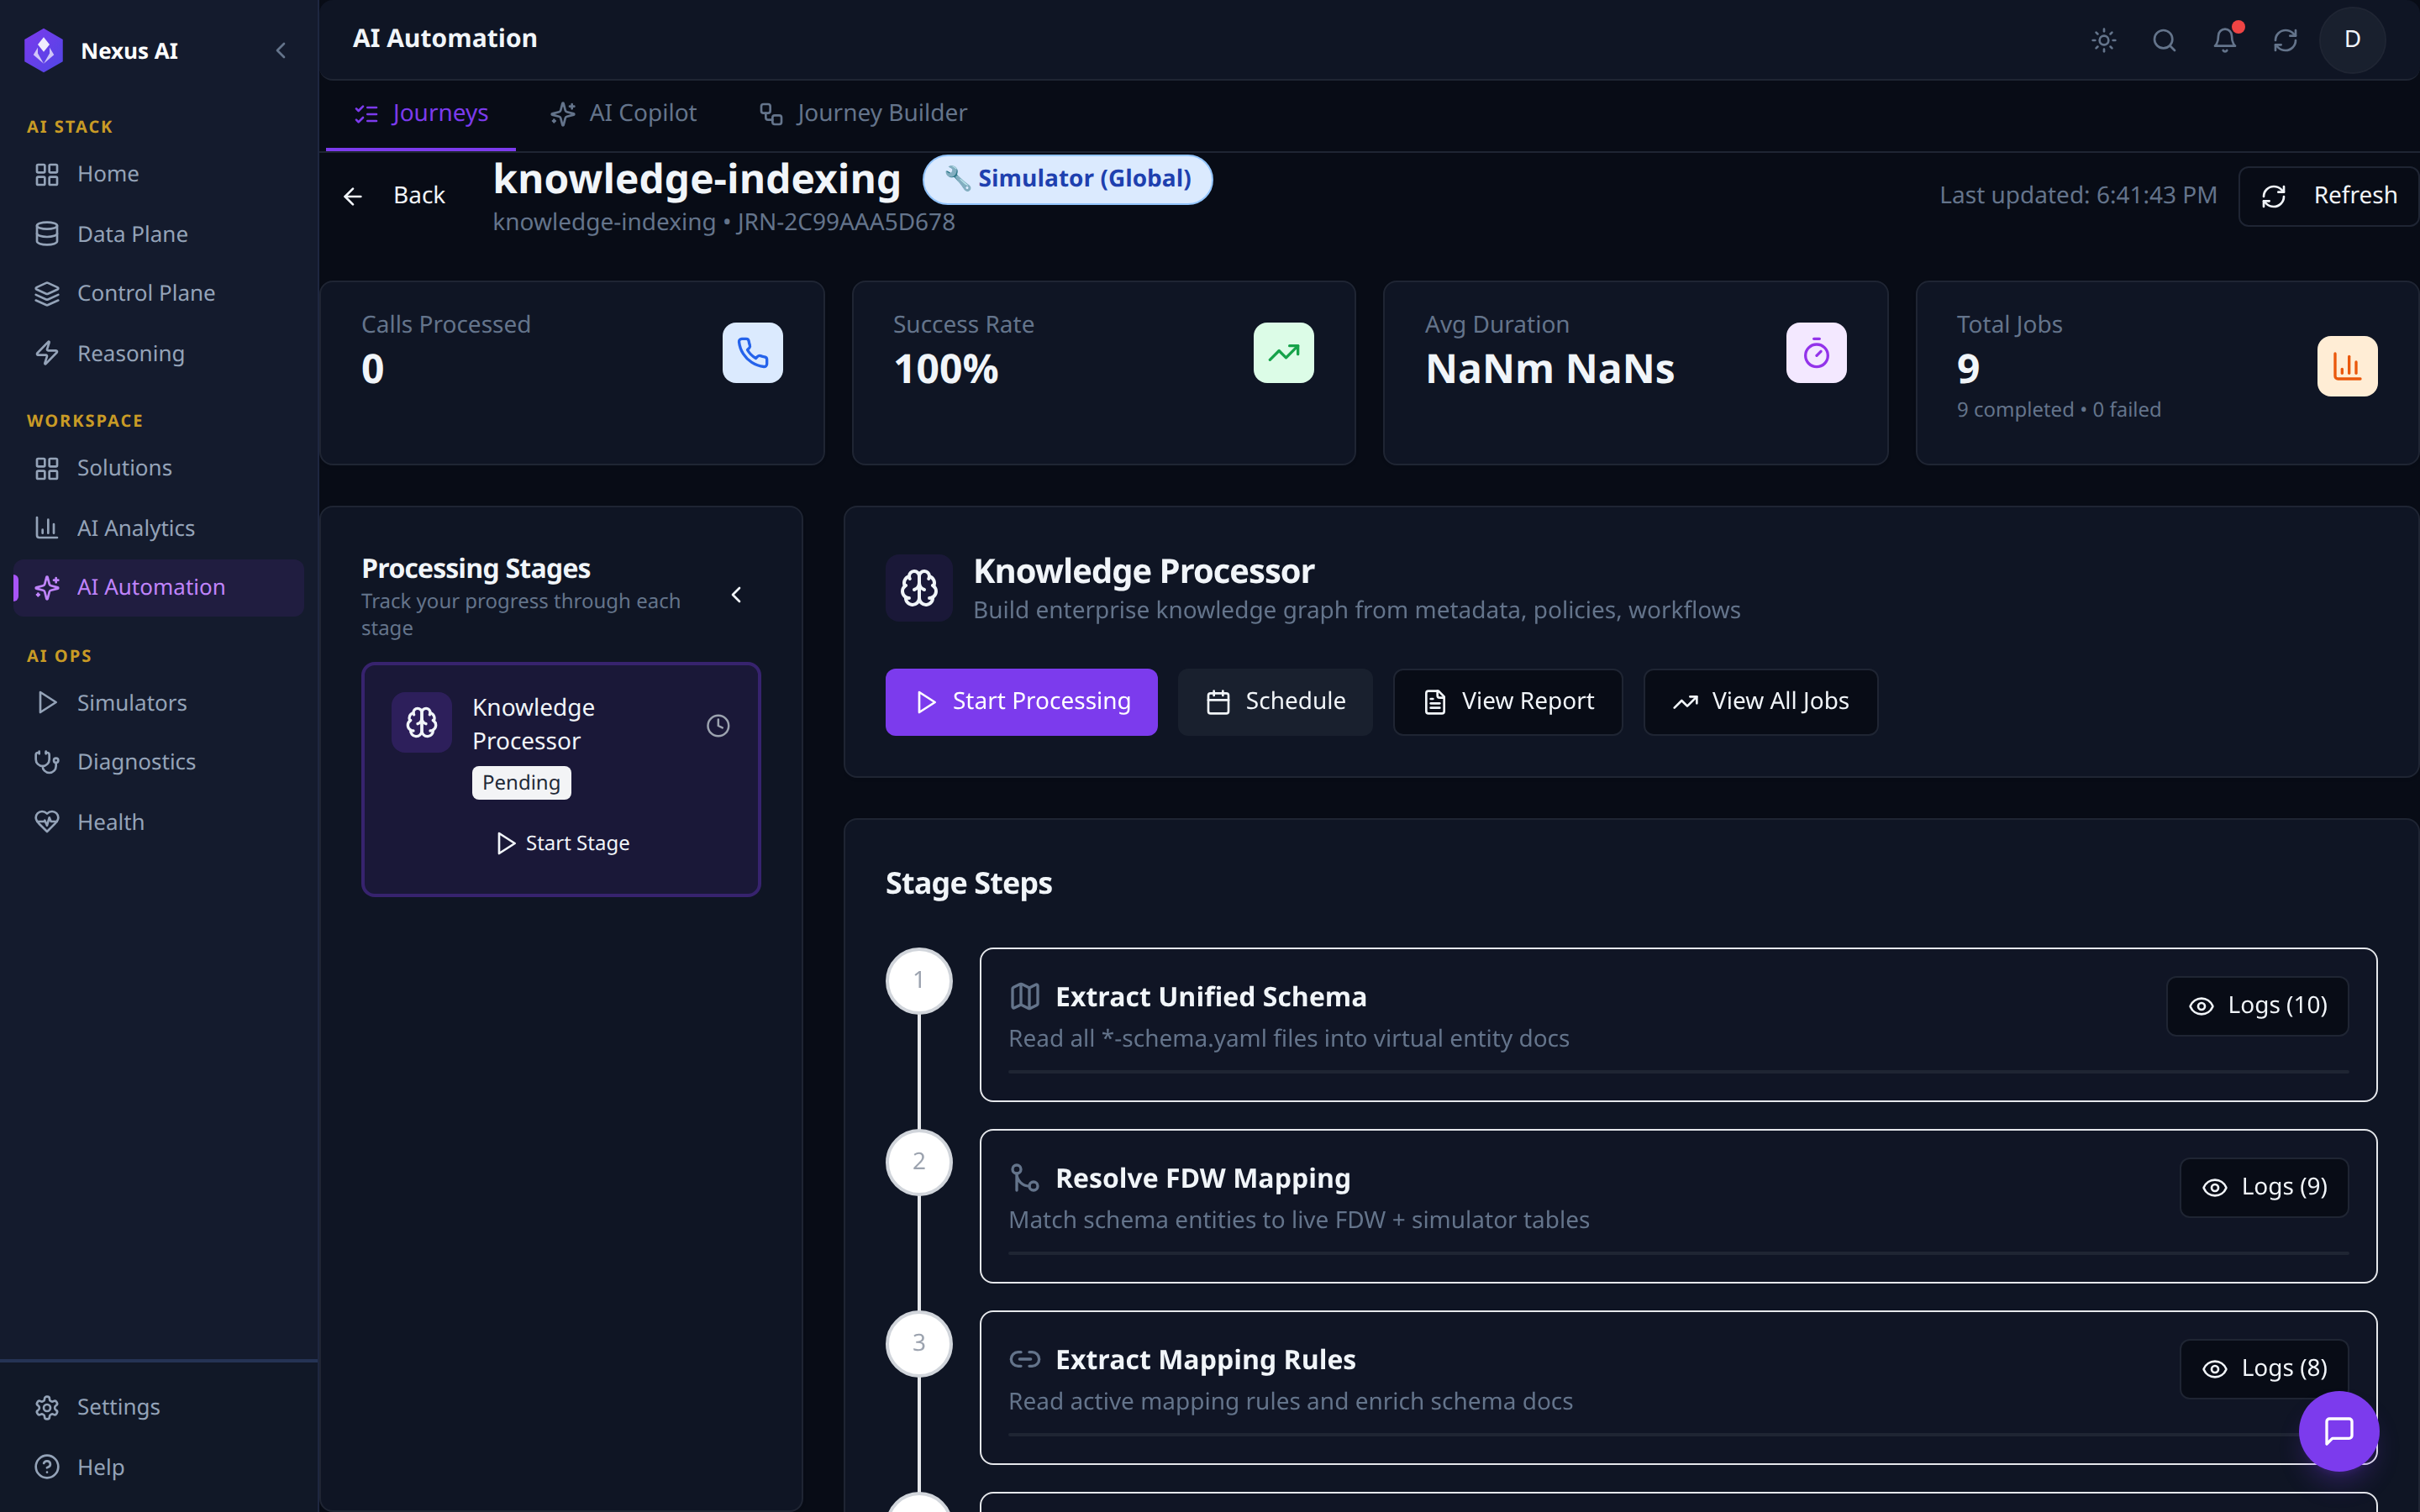
Journey Studio
Per-journey operations console -- reached from the Journey Studio button on any Journey card.
- Header -- journey name, scope badge (Simulator / Production), journey id, last-updated,
Refresh,Back. - KPI tiles -- Calls Processed, Success Rate, Avg Duration, Total Jobs (with completed / failed breakdown).
- Processing Stages (left) -- one card per stage with status badge (
Pending/Running/Done) andStart Stageaction. - Stage detail (centre) -- selected stage's description and run controls (
Start Processing,Schedule,View Report,View All Jobs). - Stage Steps -- ordered execution graph, each step with a
Logs (N)drill-in for per-step trace.
AI Ops
Cross-cutting operational capabilities that monitor and test the platform:
| Component | Purpose |
|---|---|
| Simulators | Generate test data for WXCC (contact center), SFDC (CRM), Oracle ERP, SAP |
| Diagnostics | System health checks, FDW connection testing, API diagnostics |
| Health | Pod status, service health, infrastructure monitoring |
Technology Stack
| Layer | Technologies |
|---|---|
| Frontend | React + TypeScript, Vite, Tailwind CSS, shadcn/ui |
| Backend | Python 3.11+, FastAPI, MCP HTTP Gateway |
| Database | PostgreSQL with Apache AGE (graph) + pgvector (embeddings) |
| Data Integration | PostgreSQL FDW (Foreign Data Wrappers), ETL pipelines, Change Data Capture (CDC) |
| AI/LLM | OpenAI / Anthropic via ReAct agent loop |
| Infrastructure | AWS EKS, ECR, S3, CloudWatch, Cognito |
| Orchestration | Nexus Kubernetes Operator (NexusCapability CRD) |
| CI/CD | GitHub Actions, Docker, Helm |