AI Analytics
Turns the Virtual Data Layer into business insight — manages the lifecycle of dashboards and views and binds them back to specific Solutions so each app gets its own purpose-built navigation.
For platform-overview framing see Platform Architecture > AI Analytics.
Capabilities
- Dashboards — multi-panel reports built on the VDL, classified by intent (Outcomes / Predict / Diagnose / Monitor).
- Views — reusable analytical surfaces, the building blocks that compose into Solution UIs.
- Four-Views Framework — Outcomes / Predict / Diagnose / Monitor, auto-seeded for every Solution.
- Solution Mapping — bind Views to Solutions so each shows up as a left-menu item in its Solution UI.
- Search & Tags — free-text search plus typed tags (
four-views,outcomes,monitor,customer-360,esg-sustainability, ...). - Dashboard Builder — multi-step canvas with the AI Query Builder for natural-language-to-VDL query authoring.
Walkthrough
Three tabs cover browsing, authoring, and binding of dashboards and views — plus a multi-step Dashboard Builder drill-down reached from + New Dashboard.
Dashboards
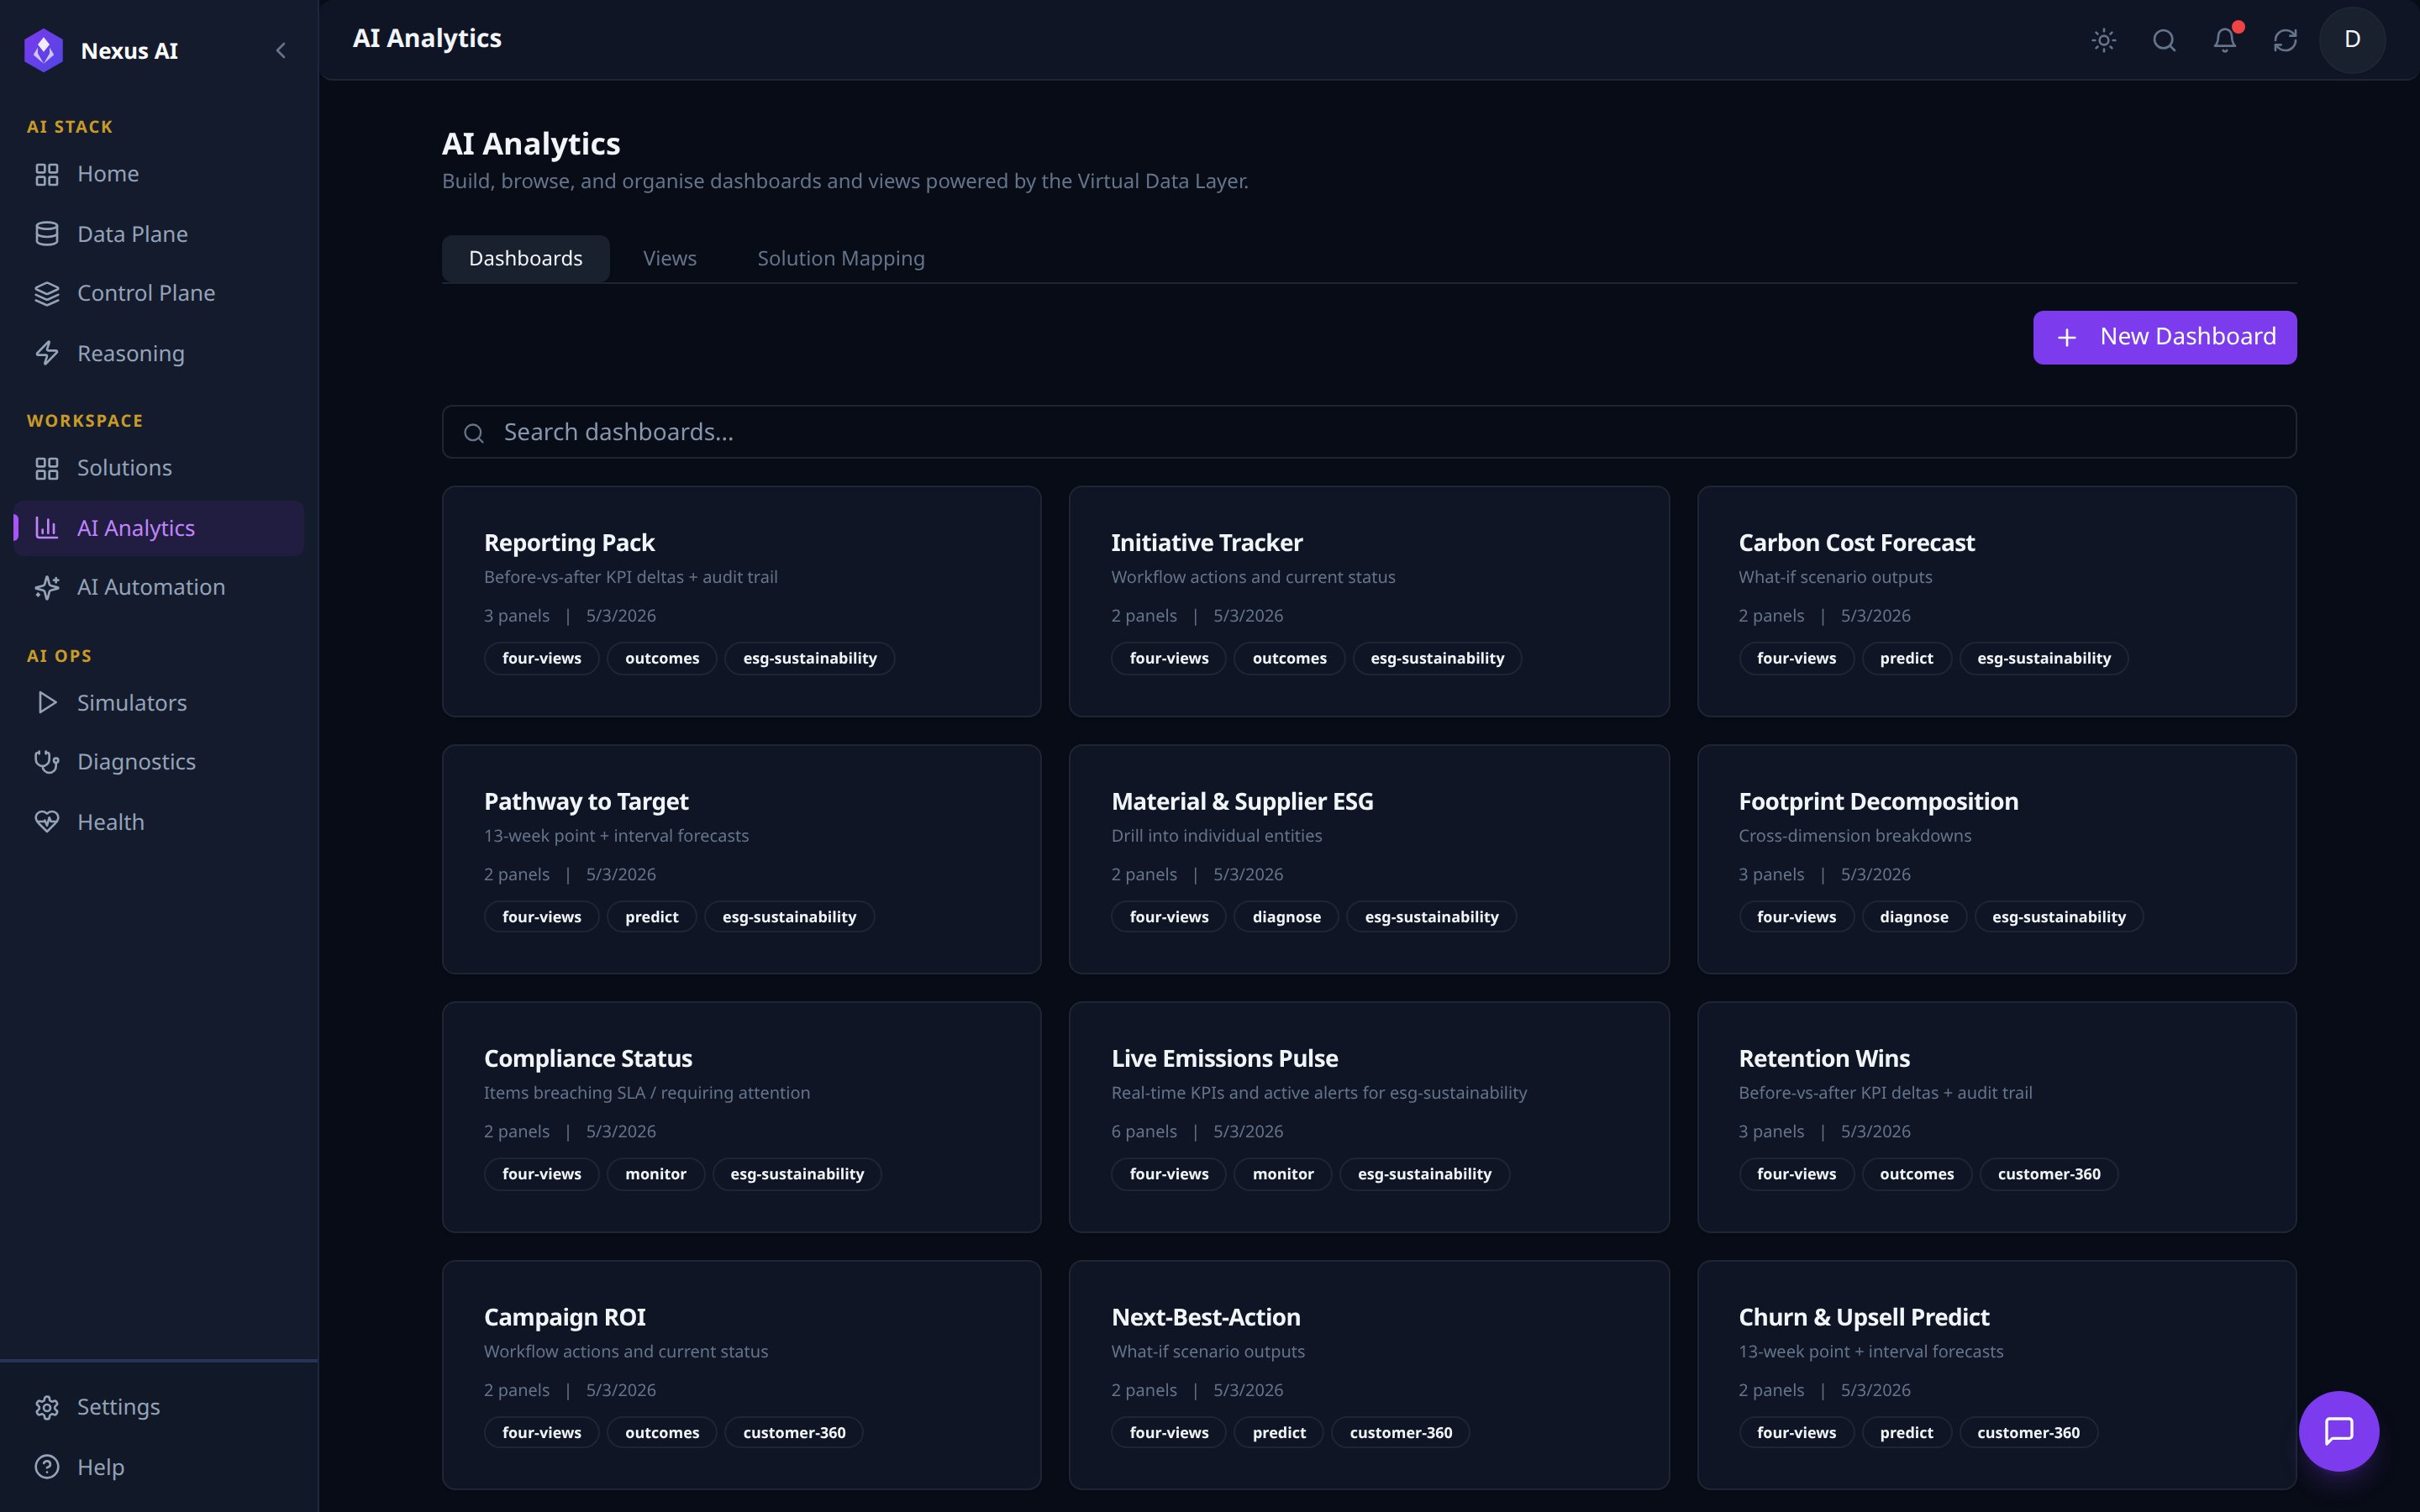
- Per-card: name, one-line description, panel count, last-updated date.
- Tags by intent (Outcomes / Predict / Diagnose / Monitor) and target Solution slug.
+ New Dashboardopens the Dashboard Builder.
Views
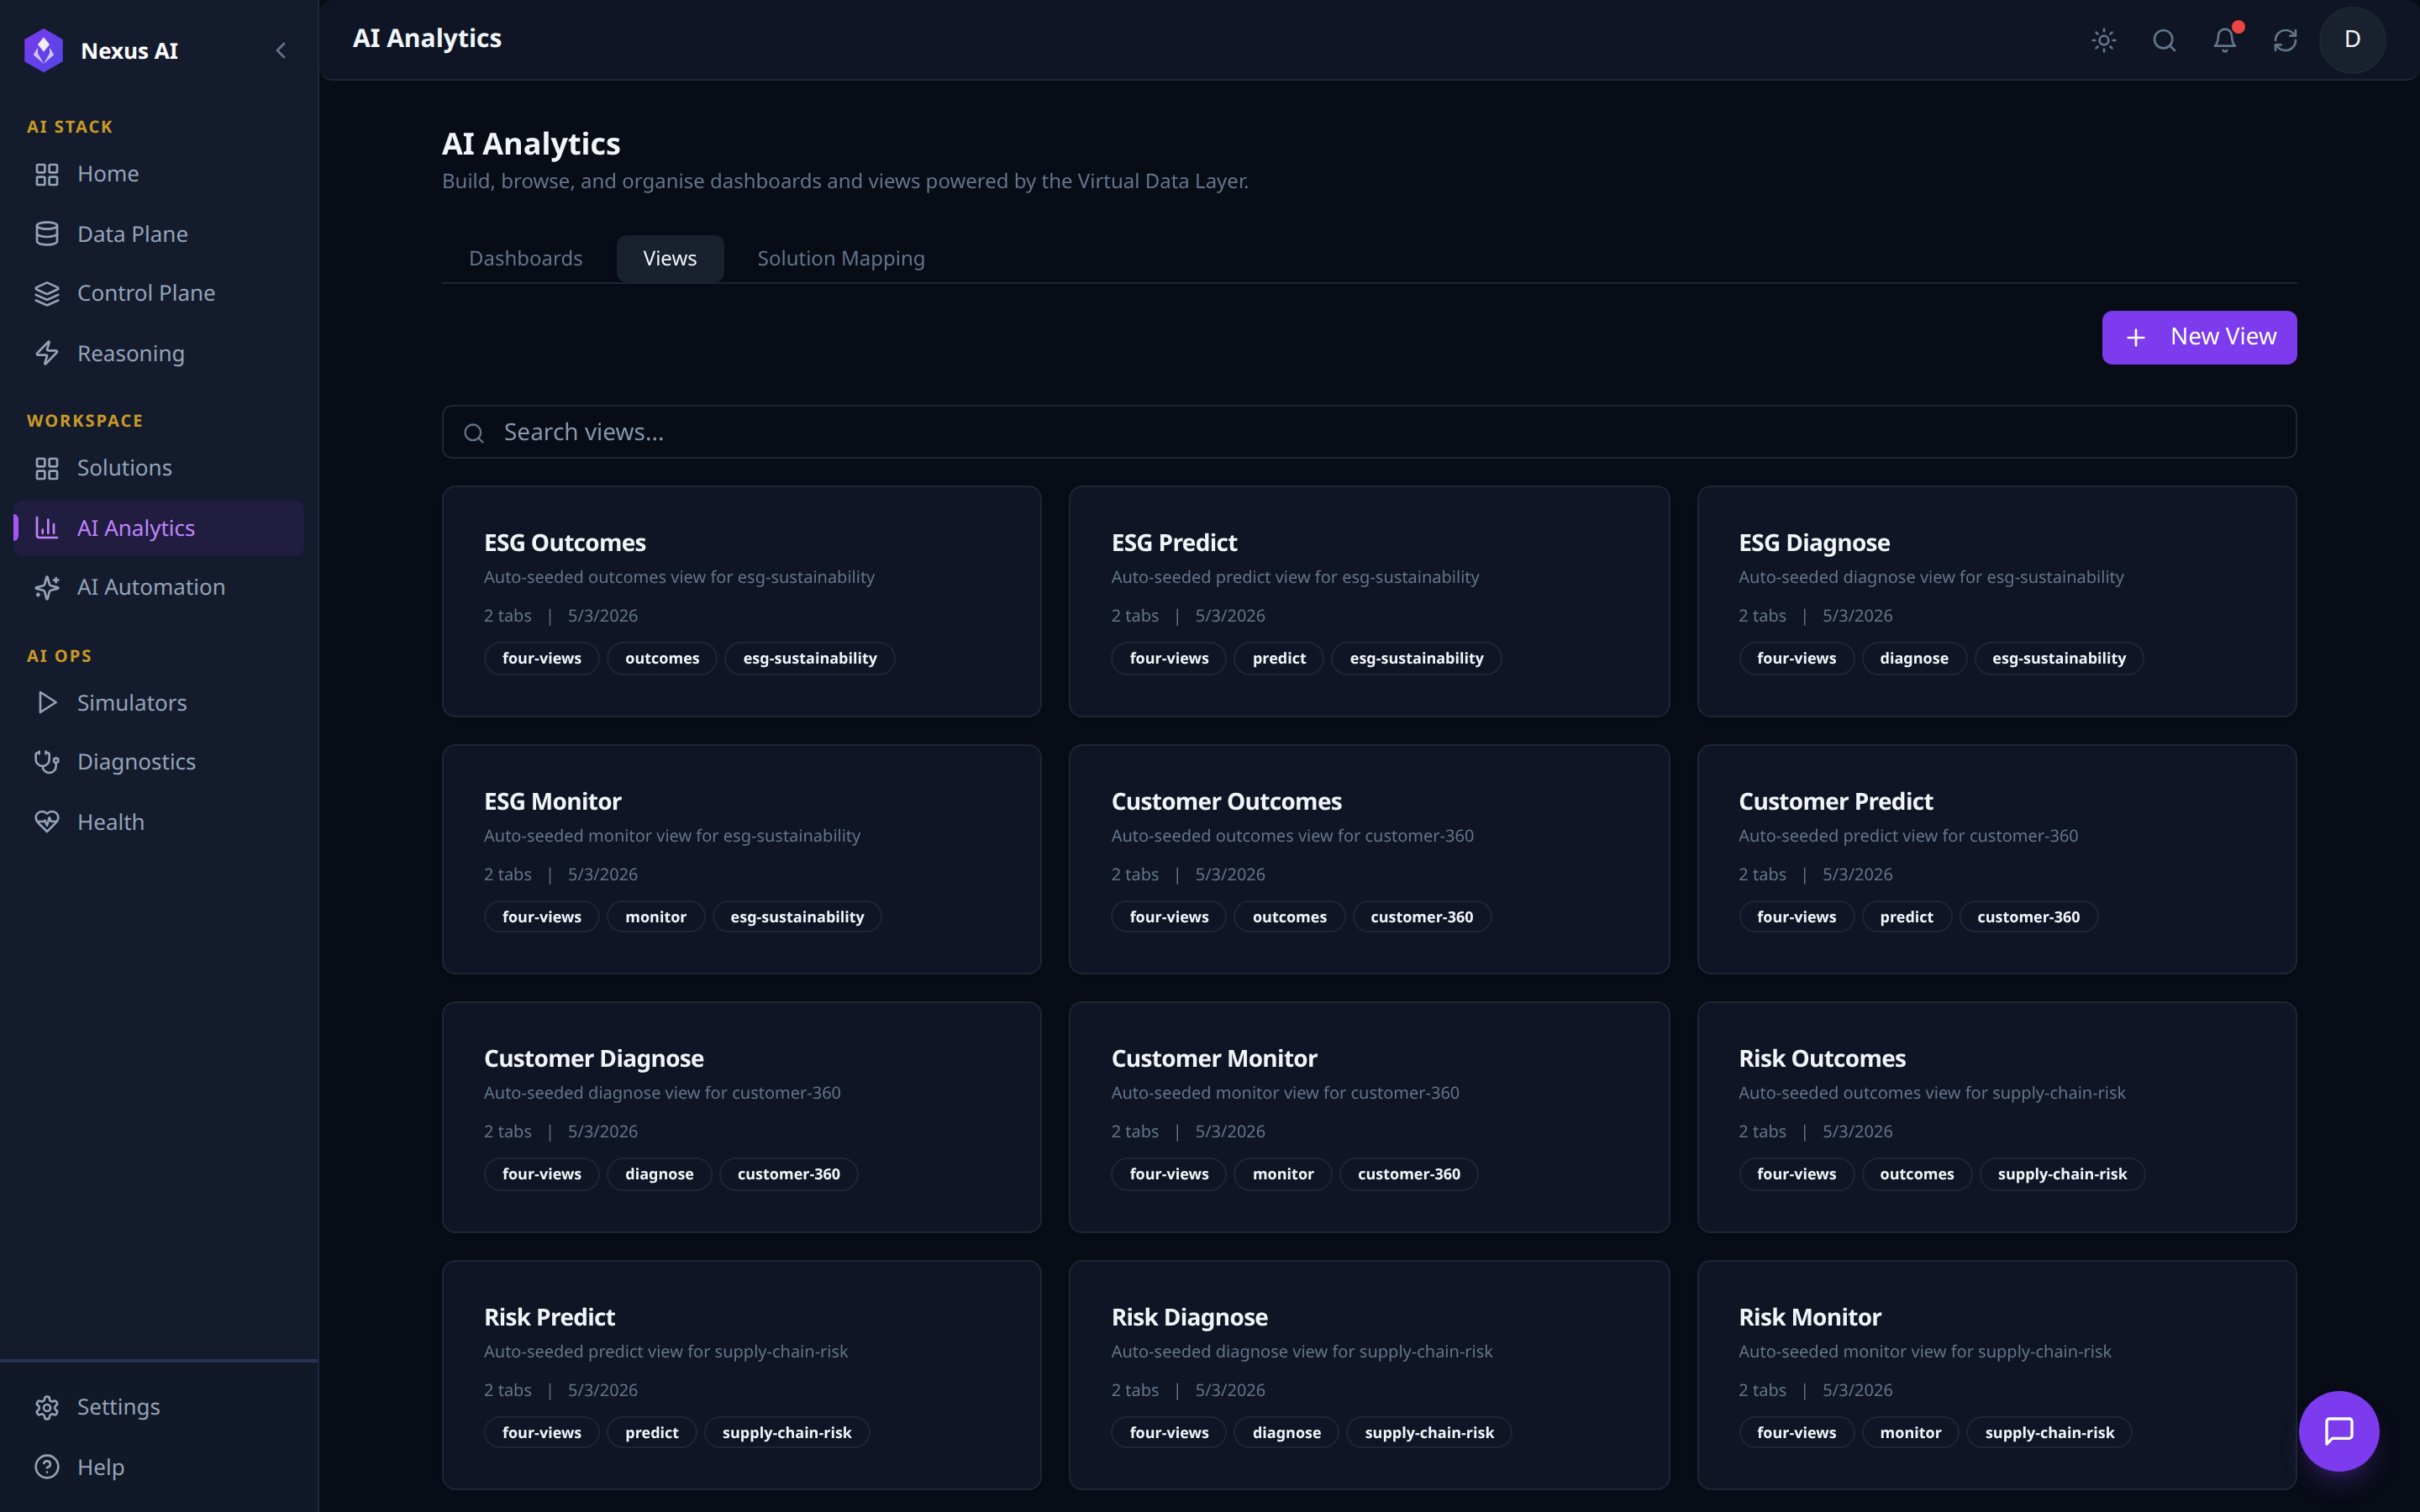
- Auto-seeded four-views per Solution (Outcomes / Predict / Diagnose / Monitor).
- Per-card: classification + Solution tags, sub-tab count, last-updated date.
+ New Viewfor custom surfaces beyond the auto-seeded set.
Solution Mapping
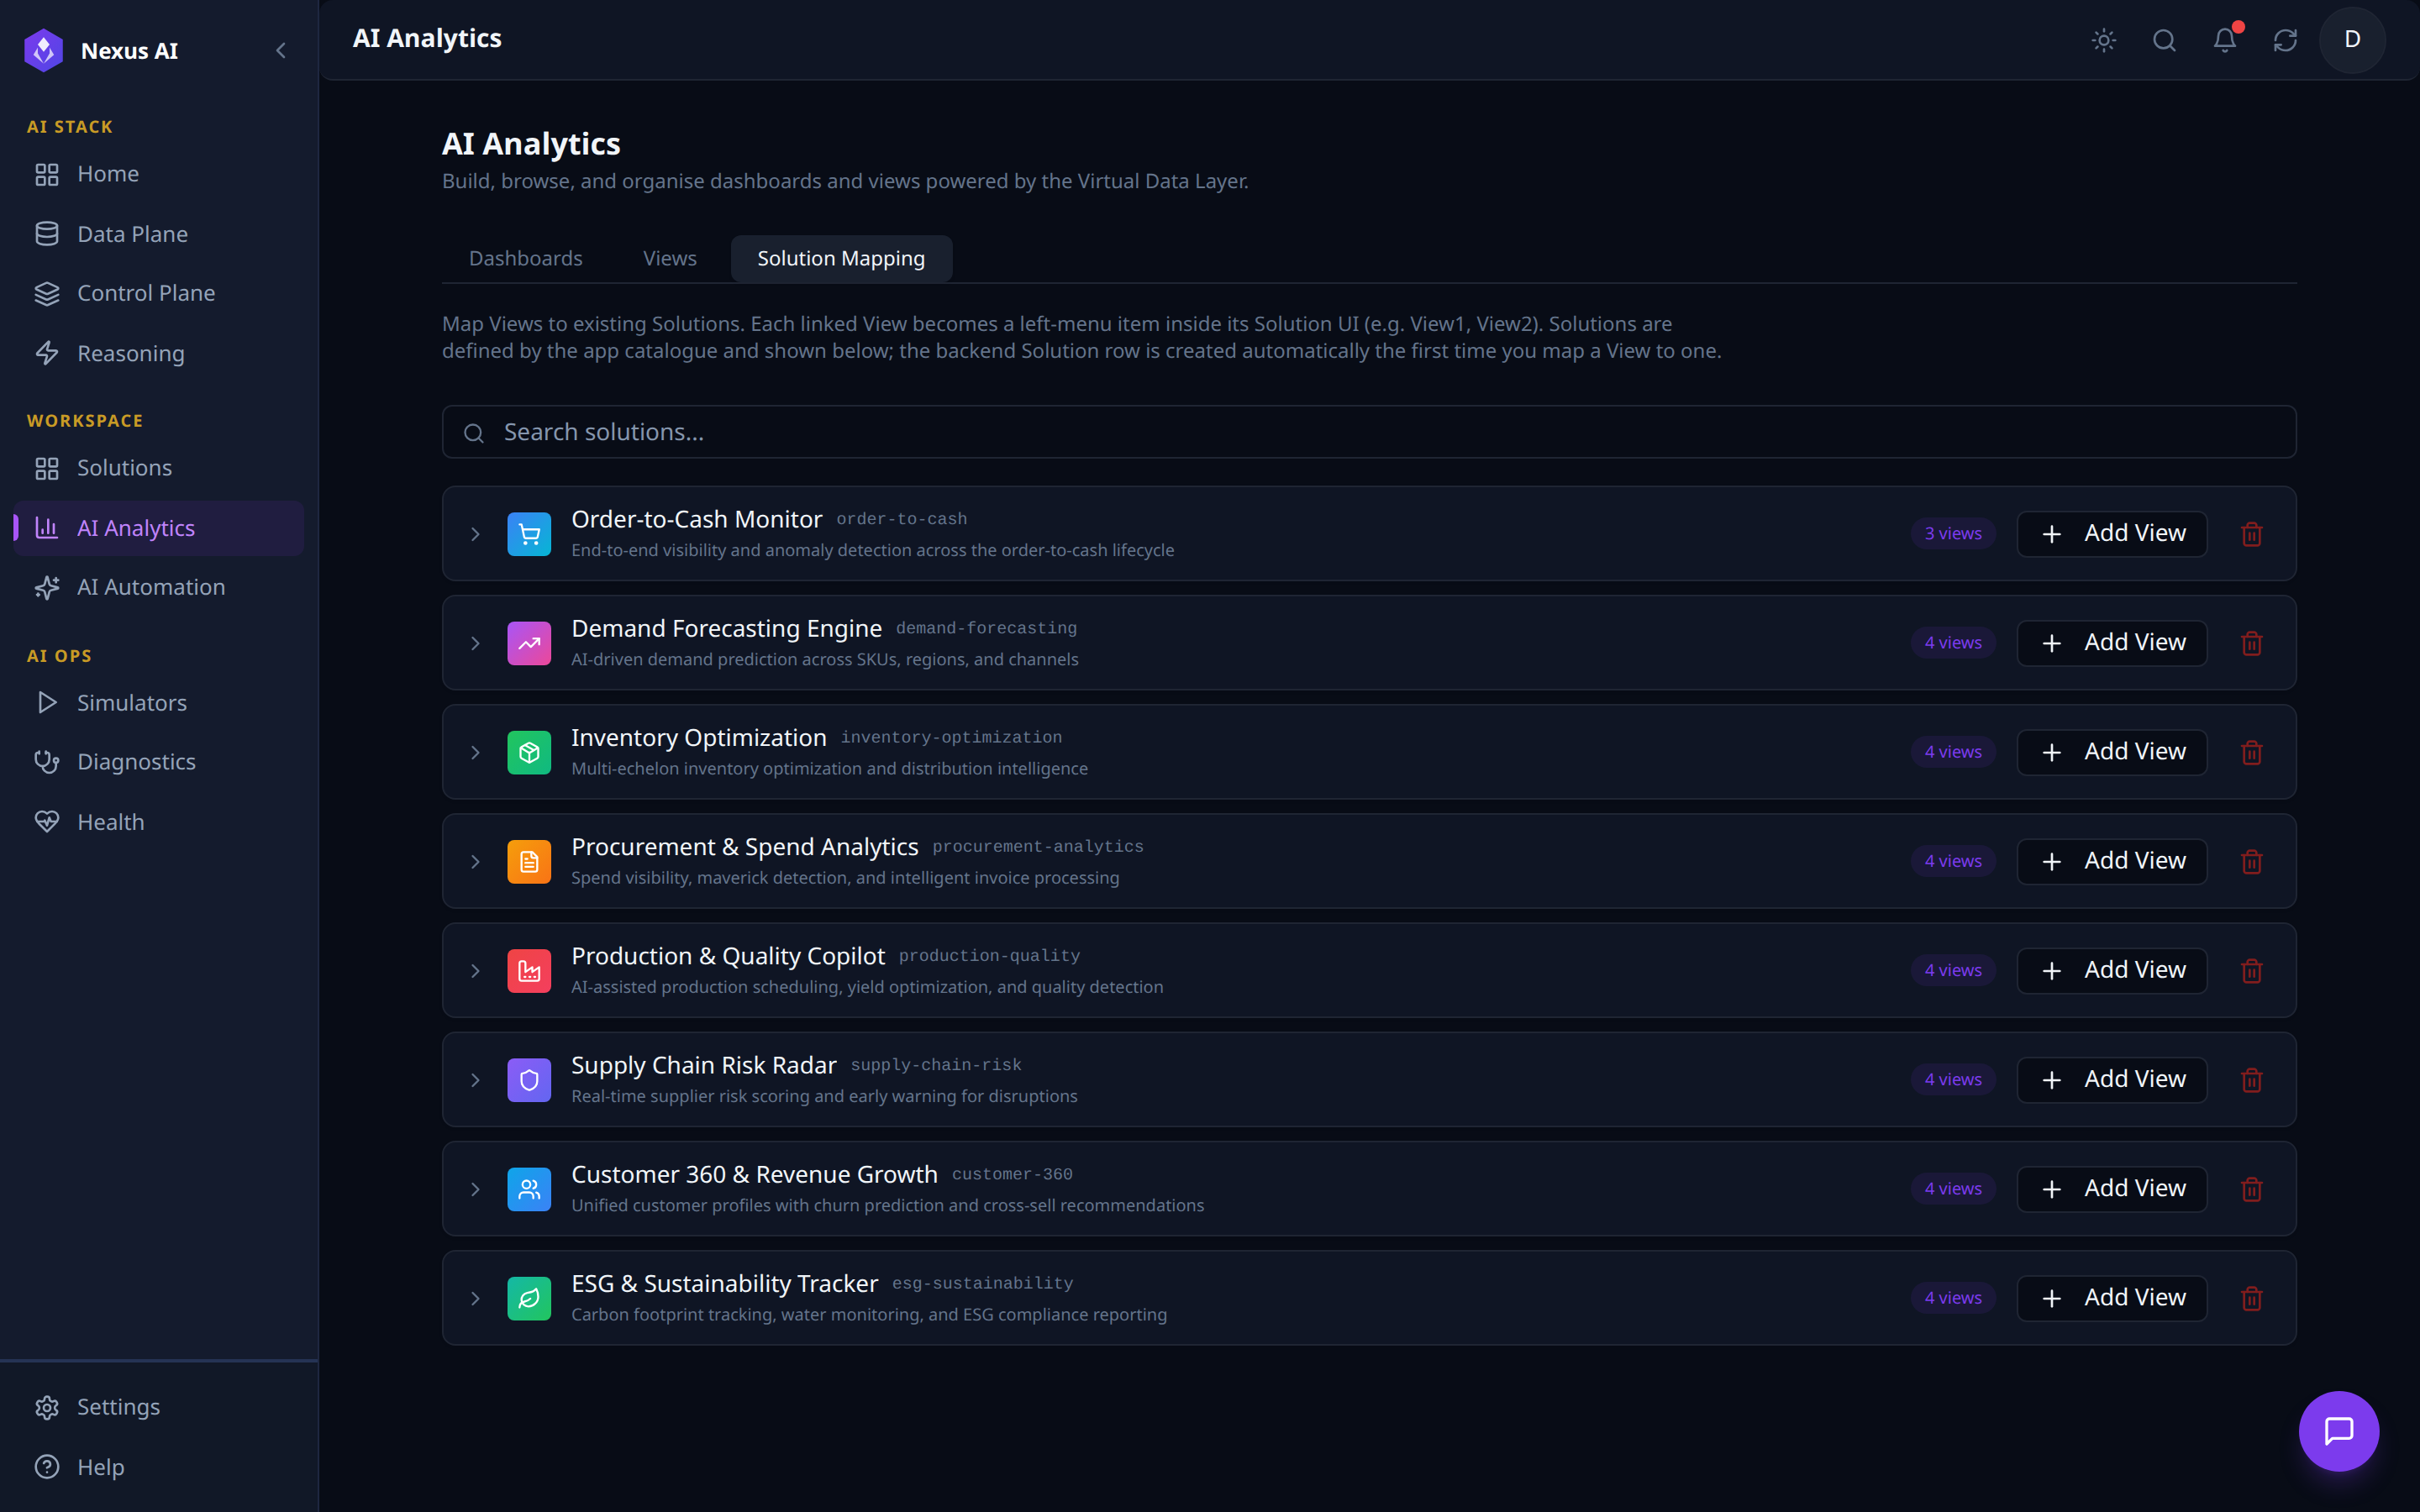
- One row per catalogue Solution with current view count and slug.
- Per-row actions:
+ Add Viewto bind another, trash icon to unmap all. - Auto-provisioning — the backend Solution row is created the first time a View is mapped to it.
Dashboard Builder
Multi-step canvas reached by clicking + New Dashboard. It walks the author through three stages: pick a panel type, wire up its data with the AI Query Builder, and watch the visualisation render against the VDL.
1. Pick a Panel Type from the Add Panel Catalogue
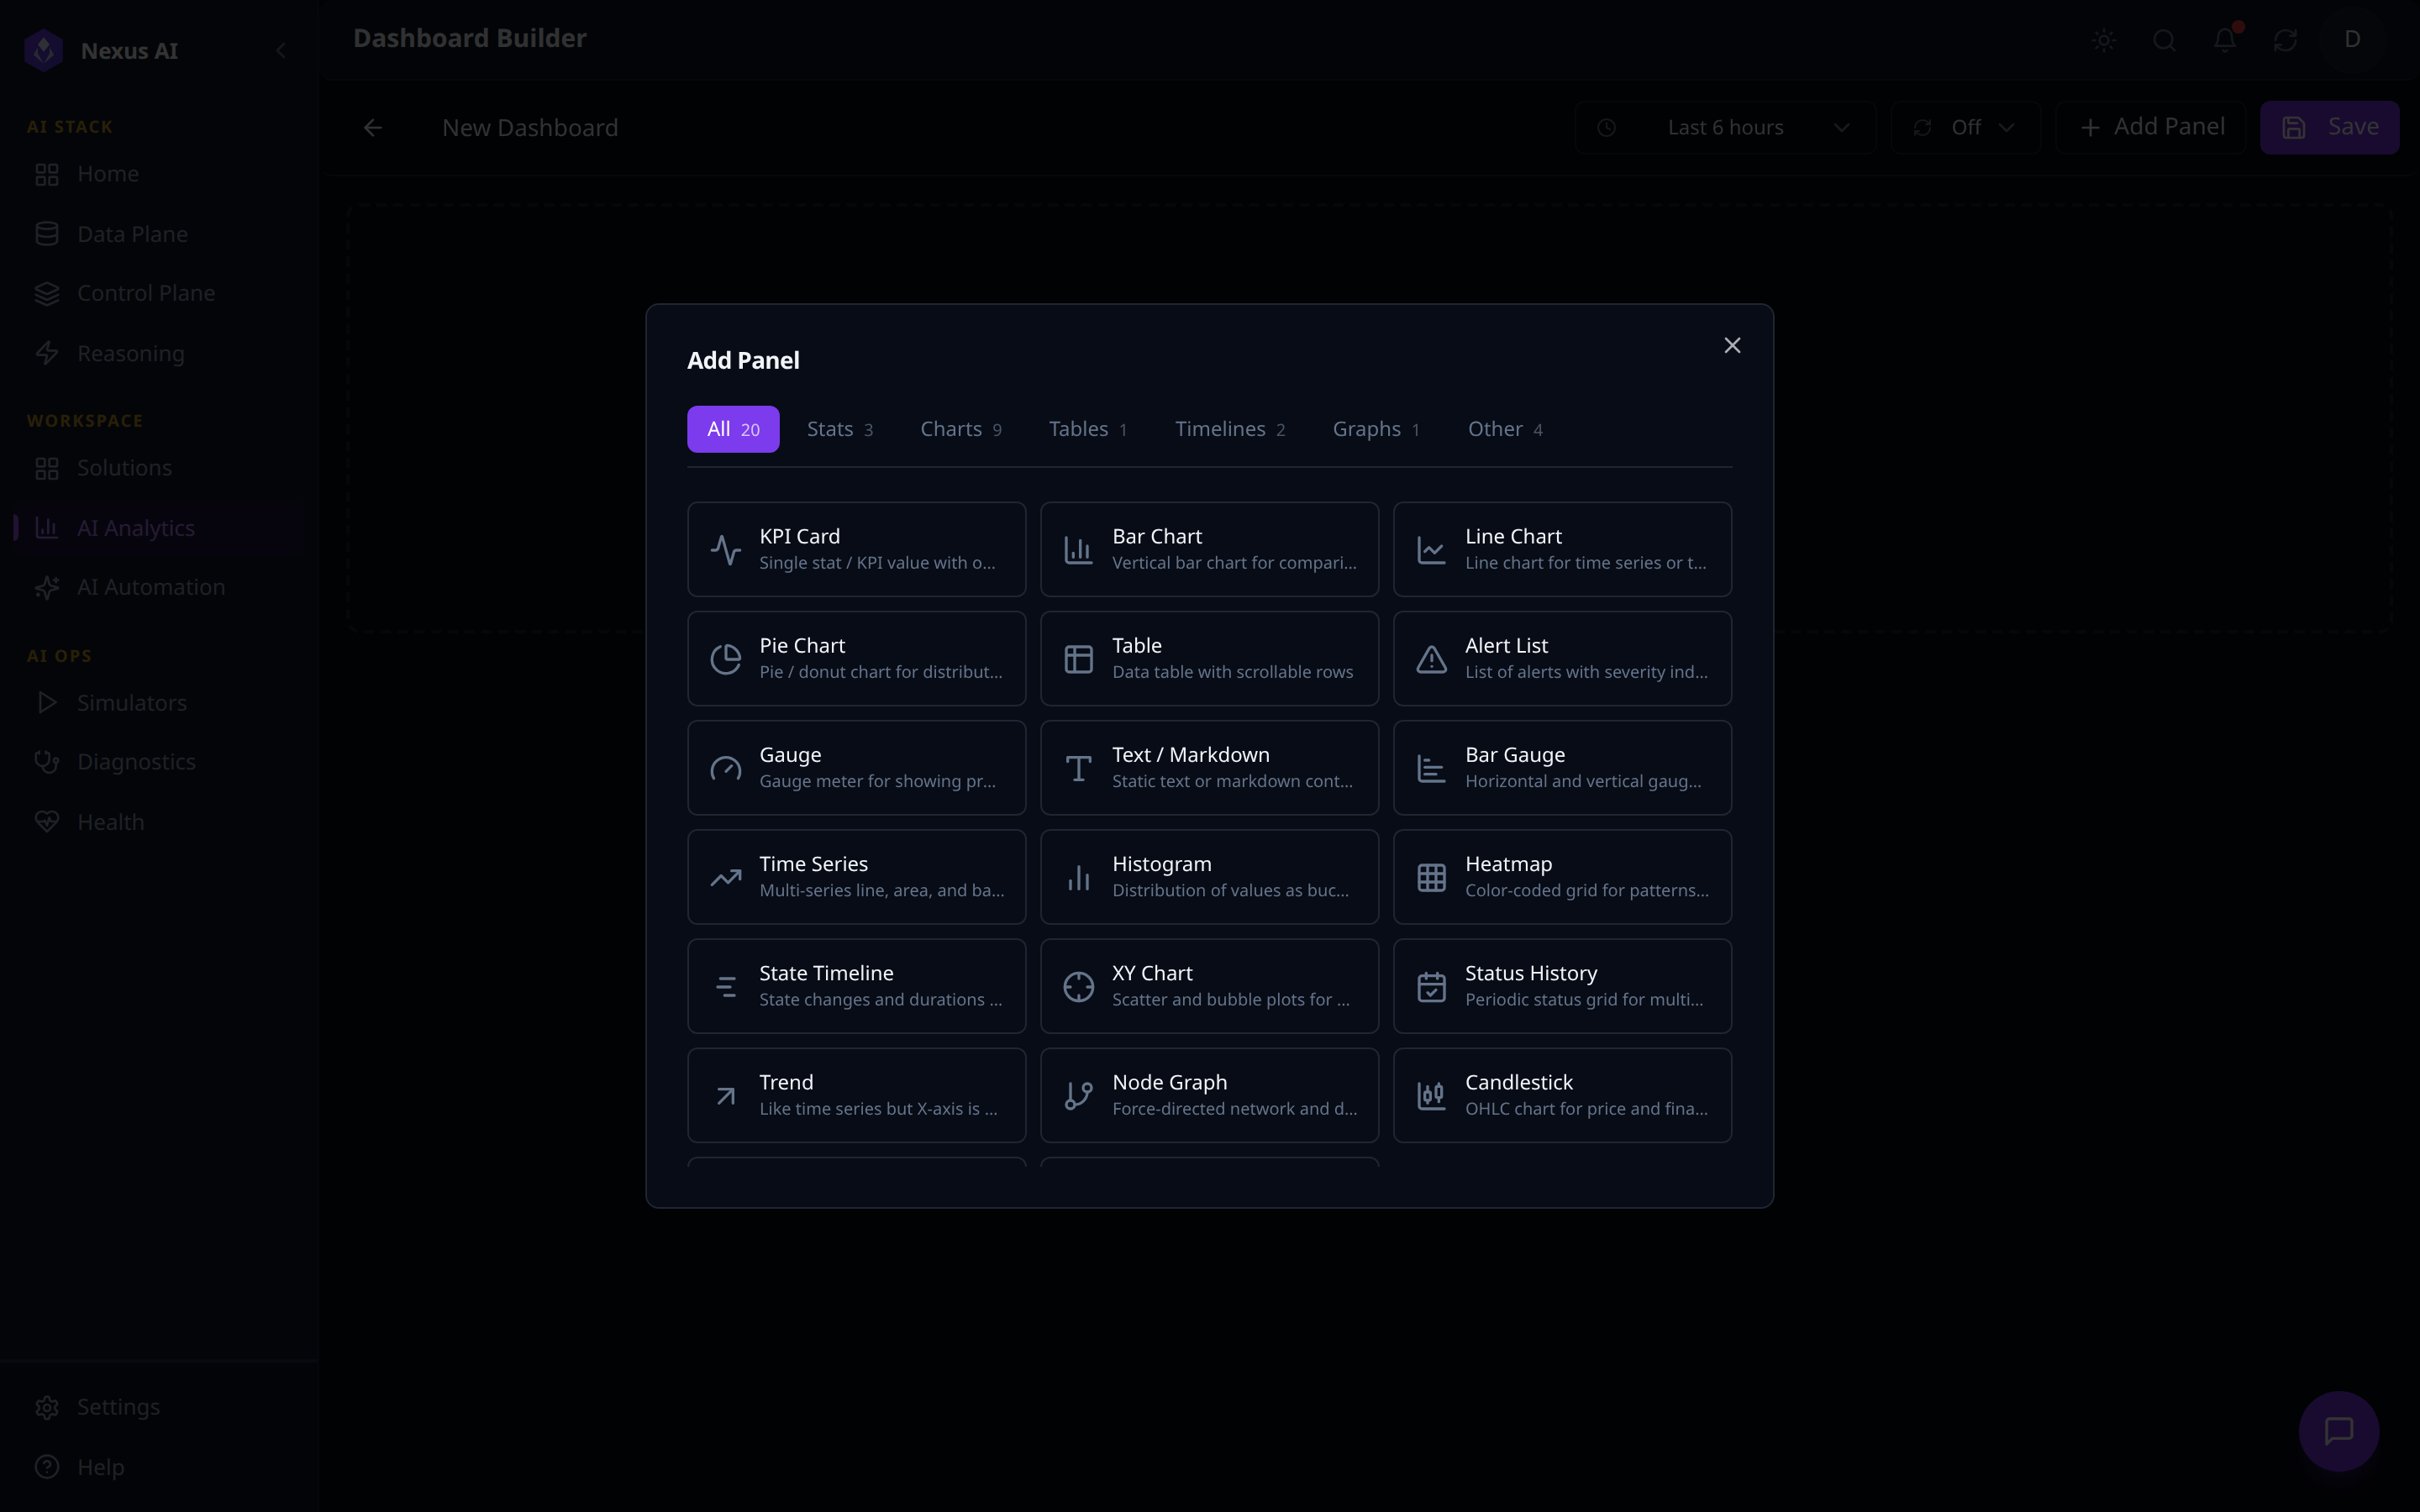
- Built-in panel types across categories: Stats, Charts, Tables, Timelines, Graphs, Other (KPI Card, Bar / Line / Pie Chart, Table, Gauge, Heatmap, Time Series, Histogram, Node Graph, ...).
- Toolbar with dashboard title, time-range picker, auto-refresh,
+ Add Panel,Save.
2. Wire the Panel Up with the AI Query Builder
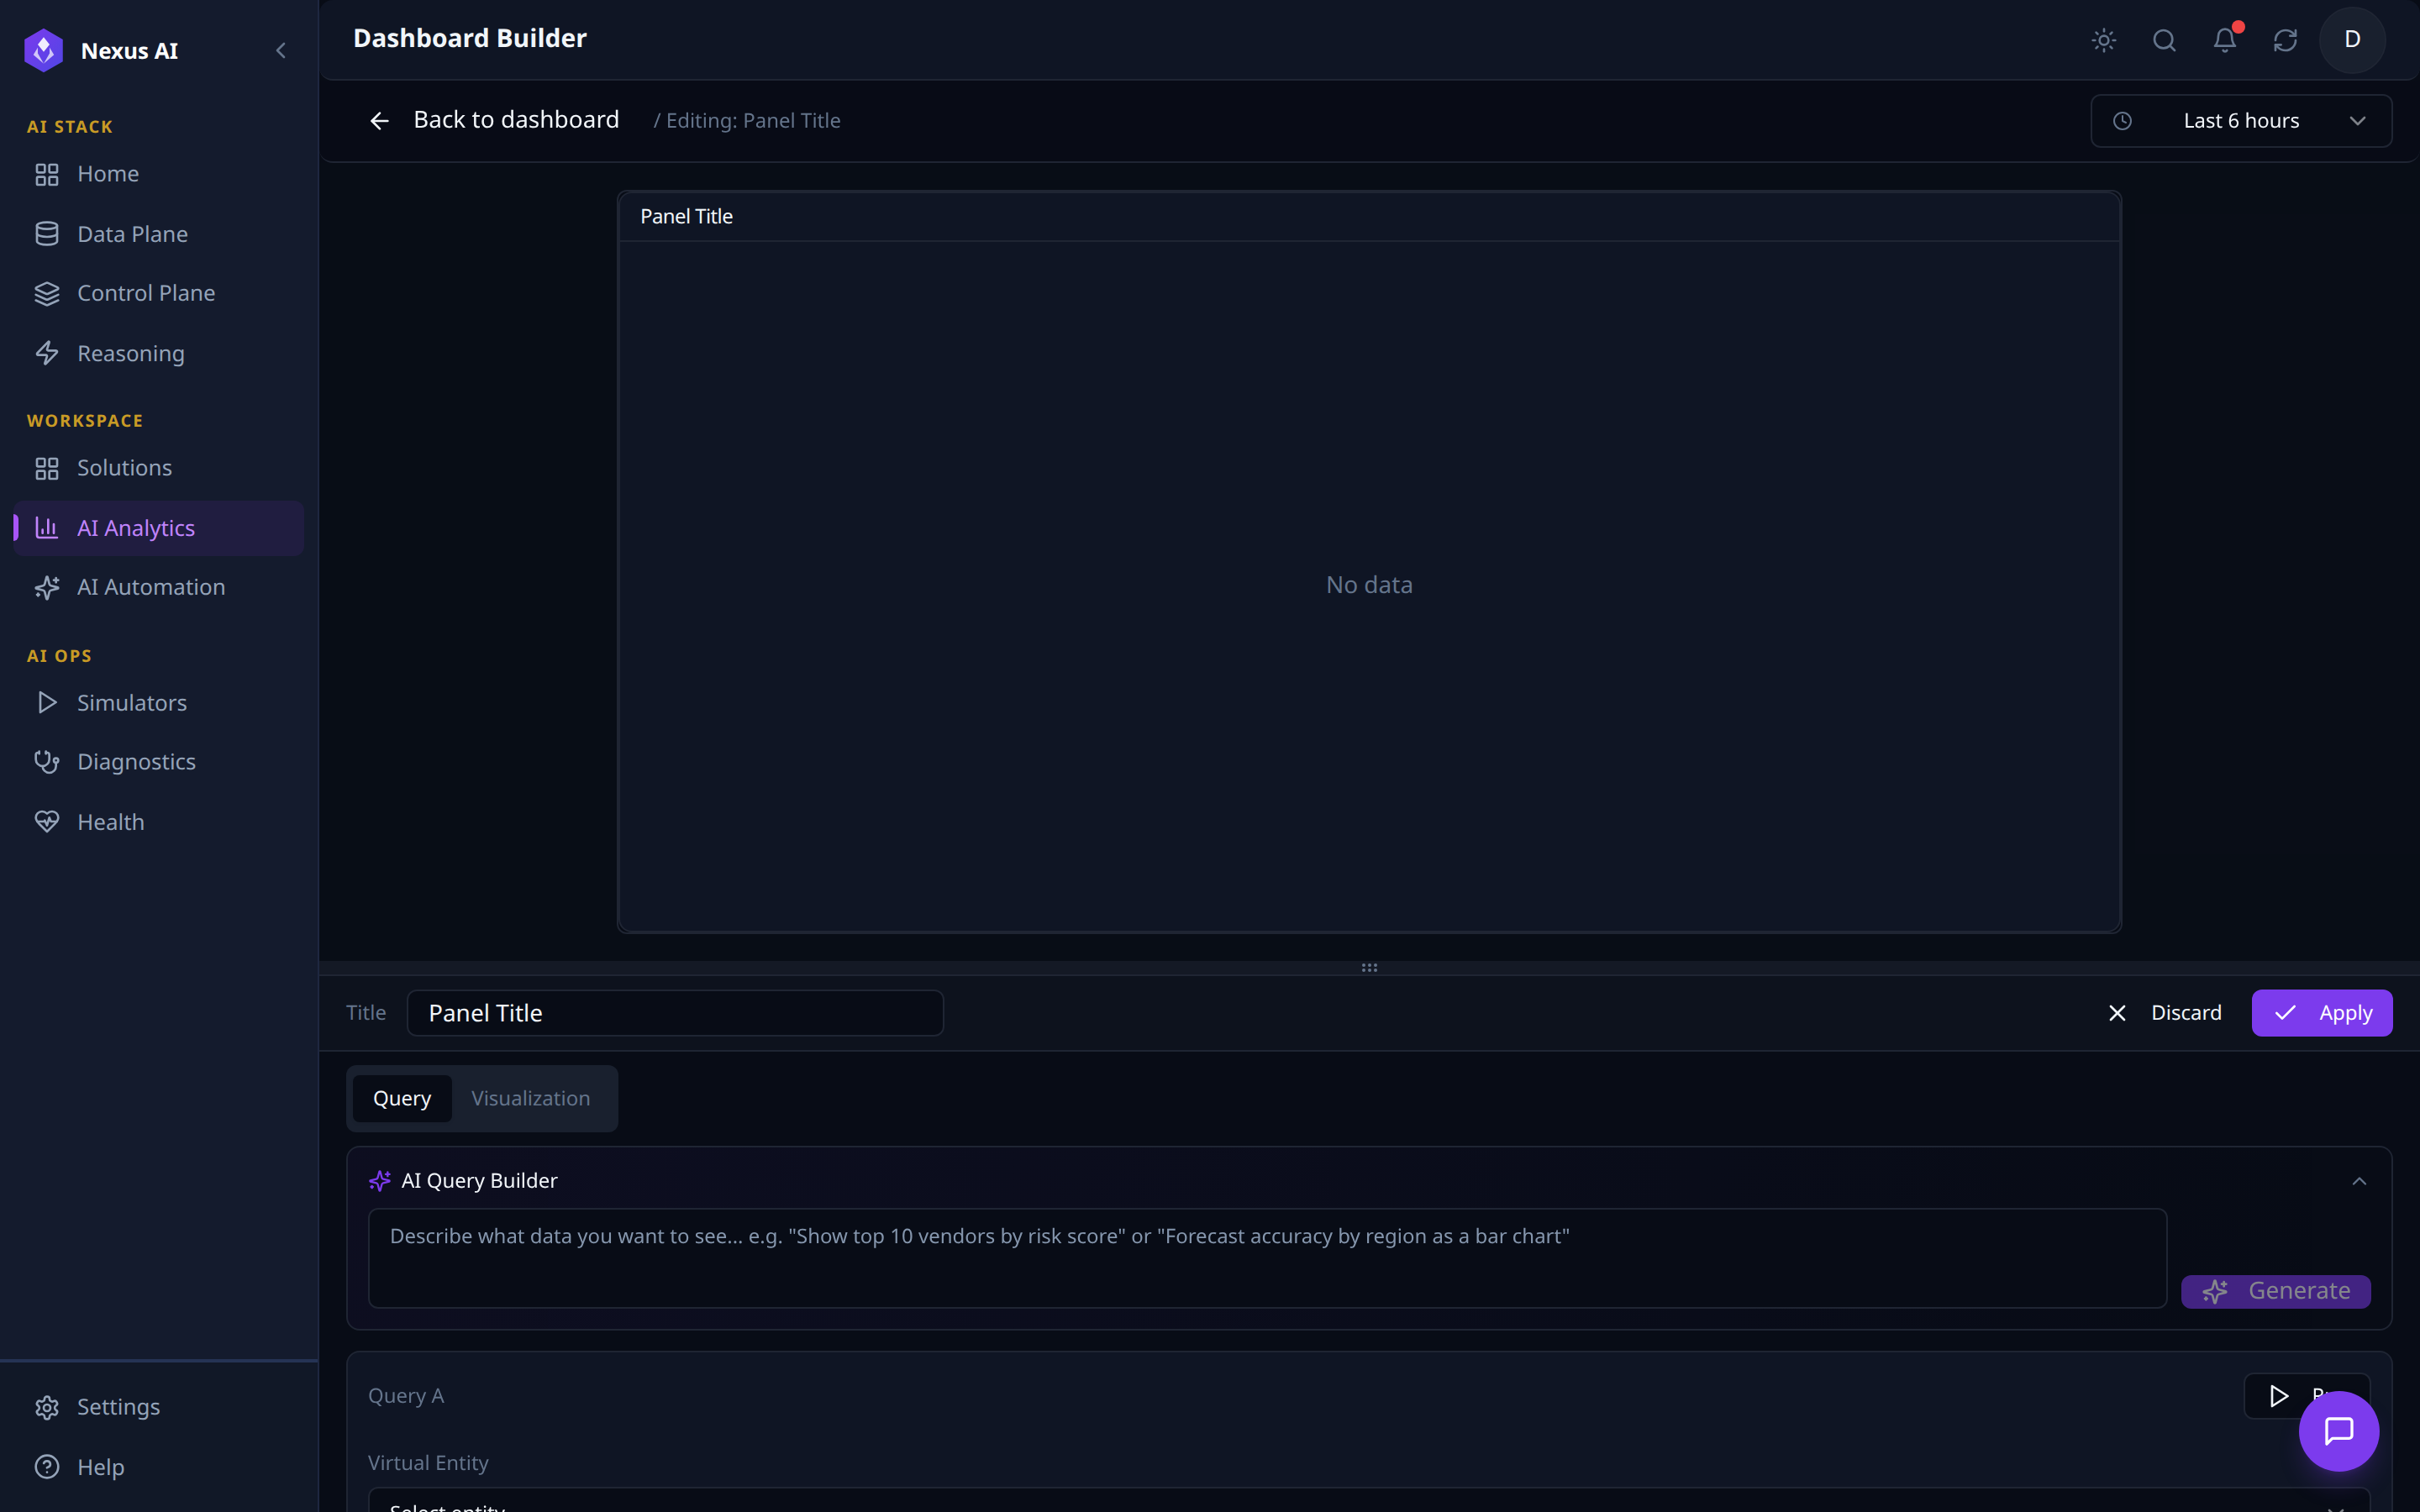
- Live preview canvas above; configuration pane below with
Query/Visualizationtabs. - AI Query Builder — natural-language prompt that generates a structured query.
- Structured Query block — Virtual Entity selector, fields, filters; runs against the VDL whether authored by hand or via AI.
3. Generate, Run, and Render Live
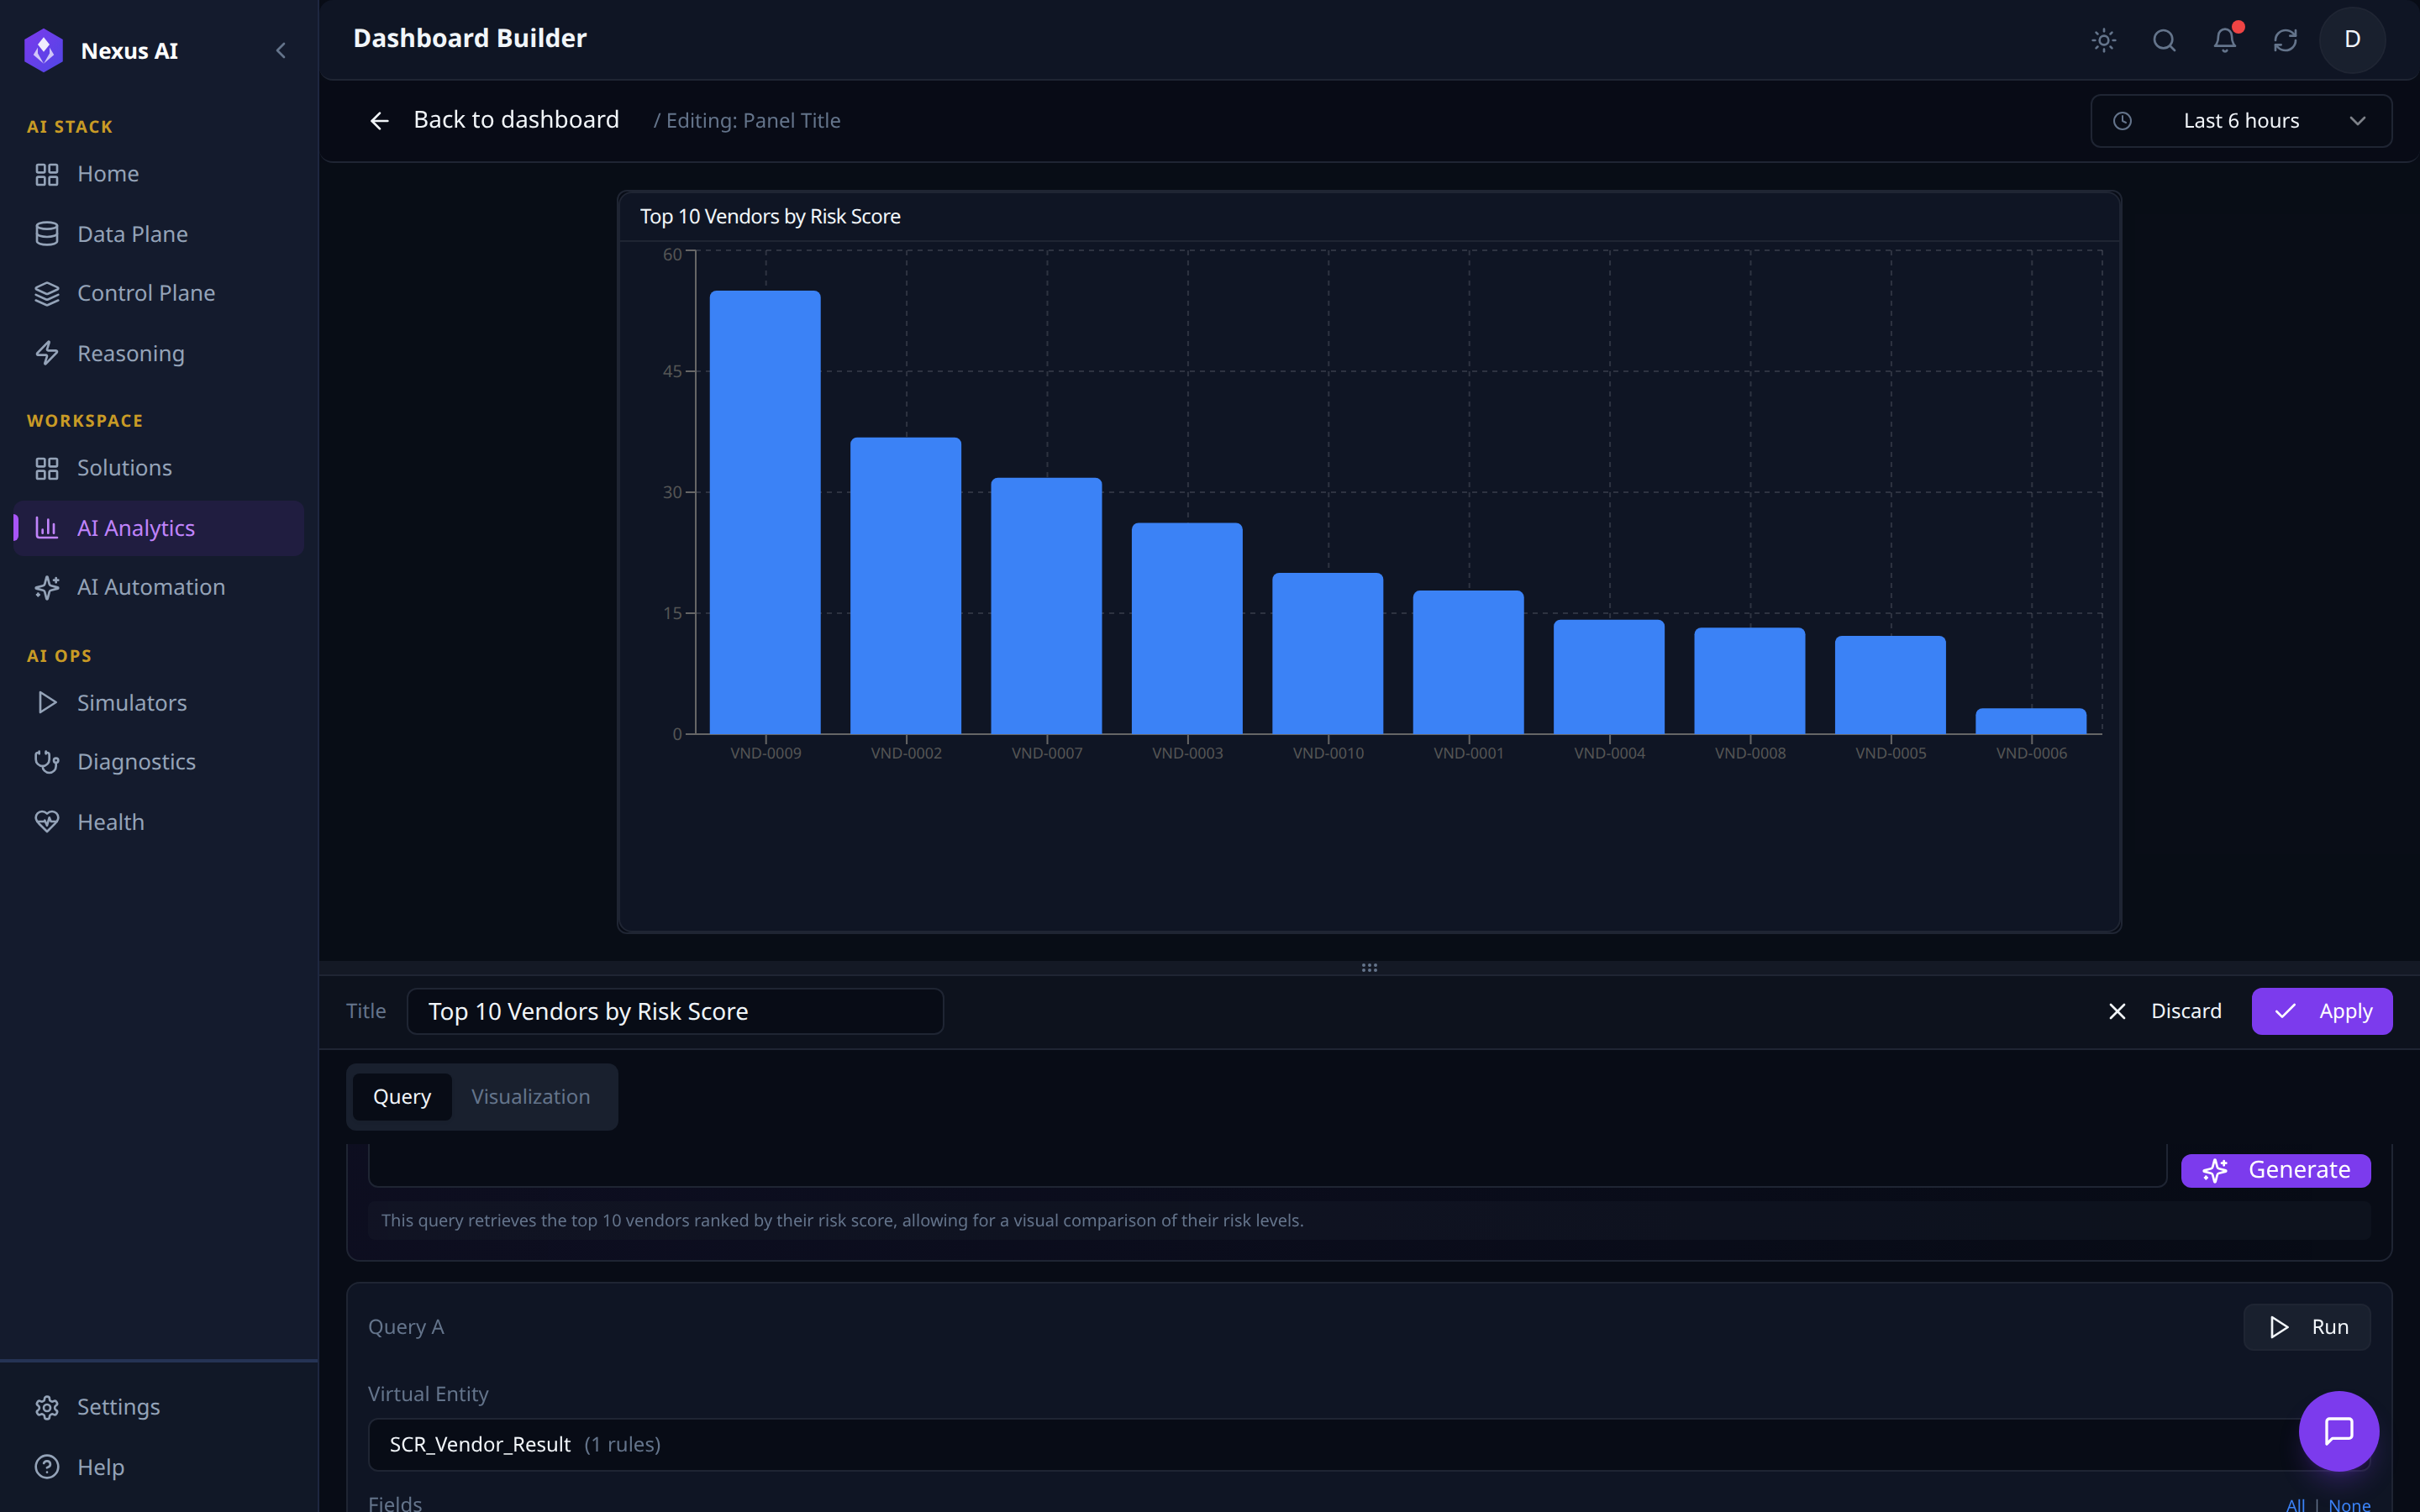
- Generate — AI Query Builder fills the structured query, auto-titles the panel, emits a one-line description.
- Live render against the resolved Virtual Entity.
- Persist with
Apply; refine axes / colours / thresholds in theVisualizationtab.
Related References
- Solutions Catalogue — where each Solution's mapped Views become its left navigation.
- AI Automation — the Journey runtime; many Dashboards and Views surface its run metrics.
- Data Plane — the Virtual Data Layer that every Dashboard query runs against.
- Implementation Guide — production code mapping for the analytics surfaces.